
Gold Price Clears Trendline Resistance After Defending March Low
Recent price action indicates that the rebound from the weekly low ($1678) could gather pace as the price of gold initiates a series of higher highs and lows, with bullion clearing trendline resistance as the US 10-Year Treasury yield pulls back from a fresh yearly high (1.77%).
The failed attempt to test the June 2020 low ($1671) seems to be generating a near-term correction in bullion as the Relative Strength Index (RSI) bounces back ahead of oversold territory, with the indicator reflecting a similar dynamic as price as the oscillator threatens the downward trend from earlier this year.
In turn, a further decline in longer-dated US Treasury yields may keep the price of gold afloat, but the from the record high ($2075) may continue to underscore a change in trend as a ‘death cross’ formation takes shape in 2021. As a result, former support may now act as resistance as the 50-Day SMA ($1772) tracks a negative slope, and the recent rebound in the price of gold may end up being a correction in the bearish trend rather than a key reversal as the 10-Year Treasury yield holds above pre-pandemic levels.
With that said, the rebound from the weekly low ($1678) may gather pace as the price of gold appears to be breaking out of the downward trend from earlier this year, but the record high ($2075) may continue to underscore a change in trend amid the broader rise in longer-dated US Treasury yields.
GOLD PRICE DAILY CHART
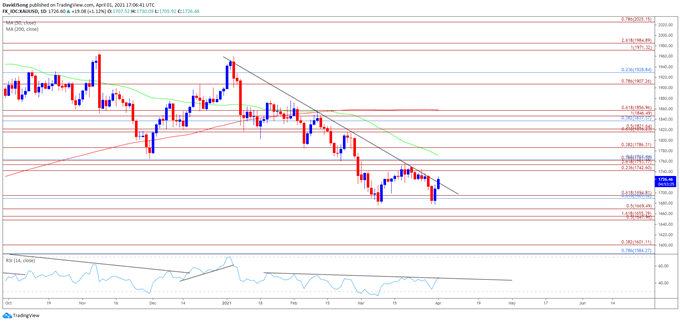
Source: Trading View
- Keep in mind, the price of gold pushed to fresh yearly highs throughout the first half of 2020, with the bullish price action also taking shape in August as the precious metal tagged a new record high ($2075).
- However, the bullish behavior failed to materialize in September as the price of gold traded below the 50-Day SMA ($1772) for the first time since June, with developments in the Relative Strength Index (RSI) negating the wedge/triangle formation established in August as the oscillator slipped to its lowest level since March.
- The RSI dipped into oversold territory in November for the first time since 2018, with the decline from the record high ($2075) indicating a potential shift in market behavior as the price of gold cleared the November low ($1765).
- It seems as though oversold readings in the RSI could be a reoccurring theme in 2021 as a ‘death cross’ formation takes shape this year, and the former support zone around $1743 (23.6% expansion) to $1763 (50% retracement)may now act as resistance as the 50-Day SMA ($1772) tracks a negative slope.
- The failed attempt to test the June 2020 low ($1671) has pushed the price of gold back above the $1690 (61.8% retracement) to $1695 (61.8% expansion) region, with bullion coming up against the overlap around $1743 (23.6% expansion) to $1763 (50% retracement).
- Need break/close above the $1743 (23.6% expansion) to $1763 (50% retracement) zone to bring the $1786 (38.2% expansion) region on the radar, with the next area of interest coming in around $1816 (61.8% expansion) to $1822 (50% expansion).
Disclosure: See the full disclosure for DailyFX here.


