Gold Price Approaches 200-Day SMA For First Time Since February
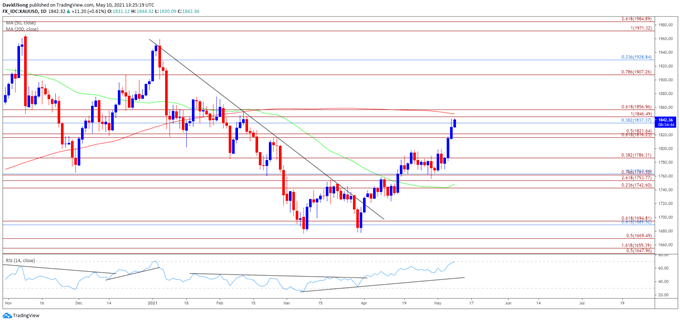
The price of gold appears to be on track to test the 200-Day SMA ($1851) for the first time since February after establishing a double-bottom formation in March, and the precious metal may continue to recoup the losses from the start of the year as long as longer-dated US Treasury yields remain under pressure.
The response to the below-forecast NFP print suggests the Federal Reserve will retain the current path for monetary policy as Richmond Fed President Thomas Barkin warns that the 266K rise in April is “nowhere near as strong as I expected,” with the 2021 voting-member on the Federal Open Market Committee (FOMC) going onto say that he will be “looking for substantial further progress” while speaking at a virtual event hosted by the West Virginia Chambers of Commerce.
The comments suggest the FOMC will stay on track to ‘increase our holdings of Treasury securities by at least $80 billion per month and of agency mortgage-backed securities by at least $40 billion per month’ as Fed officials brace for a transitory rise in inflation, and the committee may continue to strike a dovish forward guidance at its next interest rate decision on June 16 as New York Fed President John Williams insists that “we still have a long way to go to achieve a robust and full economic recovery.”
In turn, it remains to be seen if the decline from record high ($2075) will continue to underscore a change in trend as the price of gold established a double-bottom in March, with the key reversal pushing the precious metal up against the 200-Day SMA ($1851) for the first time since February.
With that said, the price of gold may continue to extend the series of higher highs and lows from the previous week as the Relative Strength Index (RSI) approaches overbought territory, and a break above 70 in the oscillator is likely to be accompanied by higher gold prices like the behavior seen in July 2020.
GOLD PRICE DAILY CHART

Source: Trading View
- Keep in mind, the price of gold pushed to fresh yearly highs throughout the first half 2020, with the bullish price action also taking shape in August as the precious metal tagged a new record high ($2075).
- However, the bullish behavior failed to materialize in September as the price of gold traded below the 50-Day SMA ($1748) for the first time since June, with developments in the Relative Strength Index (RSI) negating the wedge/triangle formation established in August as the oscillator slipped to its lowest level since March.
- Since then, the decline from the record high ($2075) indicated a potential shift in market behavior as the RSI dipped into oversold territory for the first time since 2018, with a ‘death cross’ formation taking shape earlier this year as the 50-Day SMA ($1748) developed a negative slope.
- Nevertheless, a double-bottom emerged as the price of gold failed to test the June 2020 low ($1671), with the key reversal pattern pushing the precious metal up against the 200-Day SMA ($1851) for the first time since February.
- A break/close above the Fibonacci overlap around $1837 (38.2% retracement) to $1847 (100% expansion) opens up the 200-Day SMA ($1851), with the next area of interest coming in around $1857 (61.8% expansion).
- Looming developments in the RSI may show the bullish momentum gathering pace if the oscillator pushes into overbought territory, with a move above 70 in the indicator likely to be accompanied by higher gold prices like the behavior seen in July 2020.
Disclosure: See the full disclosure for DailyFX here.


