Tuesday, November 19, 2019 5:43 AM EDT
GOLD PRICE FUNDAMENTAL AND TECHNICAL OUTLOOK
The price of gold continues to move higher, aided in part by renewed trade tensions between the US and China with suggestions now that an agreement may not be as close as recently suggested. The precious metal also got a bid from the escalation of violence in Hong Kong as extradition bill protests took another turn for the worse. US Treasury yields also fell Monday, aiding the move higher.
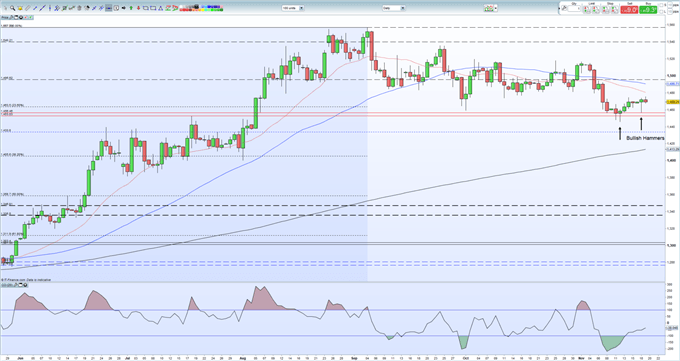
The daily chart shows that gold’s recent turnaround off its three-month saw a bullish candlestick formed, a technical signal that suggest higher prices ahead. And another hammer doji was formed yesterday as the price of gold closed near its high. Today’s price action should be noted with a close above yesterday’s high - $1.474/oz. – a bullish confirmation signal. The CCI indicator at the bottom of the chart shows that gold has moved out of oversold territory.
For gold to make another attempt at $1,500/oz. and above, the spot price will need to take out two levels of resistance. The 20-day moving average is currently around $1,480/oz. while the 50-day moving average currently sits around $1,490/oz. The first level of support for gold is the 23.6% Fibonacci retracement level at $1,463.5/oz. ahead of the $1,453 - $1,456/oz. zone.
GOLD PRICE CHART (MAY – NOVEMBER 19, 2019)
IG Client Sentiment shows how traders are positioned in a wide range of assets and markets. Retail customers are 73% net-long gold, a bearish contrarian bias. However daily and weekly sentiment shifts give us a bullish outlook.
Disclaimer: DailyFX, the free news and research website of leading forex and CFD broker FXCM, delivers up-to-date analysis of the ...
more
Disclaimer: DailyFX, the free news and research website of leading forex and CFD broker FXCM, delivers up-to-date analysis of the fundamental and technical influences driving the currency and commodity markets. With nine internationally-based analysts publishing over 30 articles and producing 5 video news updates daily, DailyFX offers in-depth coverage of price action, predictions of likely market moves, and exhaustive interpretations of salient economic and political developments. DailyFX is also home to one of the most powerful economic calendars available on the web, complete with advanced sorting capabilities, detailed descriptions of upcoming events on the economic docket, and projections of how economic report data will impact the markets. Combined with the free charts and live rate updates featured on DailyFX, the DailyFX economic calendar is an invaluable resource for traders who heavily rely on the news for their trading strategies. Additionally, DailyFX serves as a portal to one the most vibrant online discussion forums in the forex trading community. Avoiding market noise and the irrelevant personal commentary that plague many forex blogs and forums, the DailyFX Forum has established a reputation as being a place where real traders go to talk about serious trading.
Any opinions, news, research, analyses, prices, or other information contained on dailyfx.com are provided as general market commentary, and does not constitute investment advice. Dailyfx will not accept liability for any loss or damage, including without limitation to, any loss of profit, which may arise directly or indirectly from use of or reliance on such information.
less
How did you like this article? Let us know so we can better customize your reading experience.


