
Gold Peaked On Coronavirus
Virus Fears Increasing
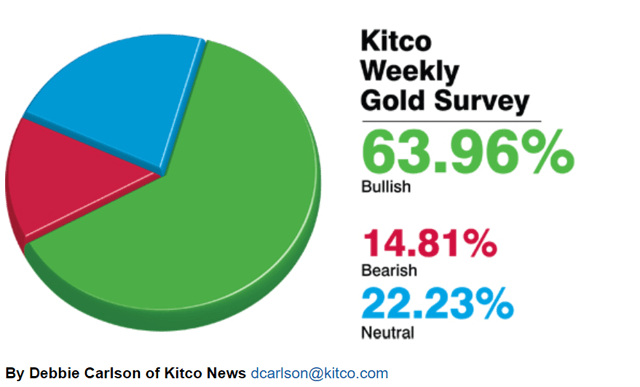
As we begin the month of February 2020, I wanted to look at the news that appears to be predominantly spurring the metals rally for the past week. Voters in the Kitco Gold Survey remain bullish on the metals. Traders and analysts cite ongoing worries about the fallout from the coronavirus that hit China, with a small number of cases making their way to other countries. There's no question that there's cause for concern regarding the economic effect of the virus on a global scale. If it continues to spread worldwide, we could see more restrictions and cancellations of visas and, in turn, slowing down of the world economy, especially if it turns into a global panic and countries retreat into isolation until this is over. I can’t help but see that this virus affected gold and took it to a high of $1,595.50 last week. This puts the previous target of $1,613 into play as the next target. When we take a look at the Kitco survey, 17 market professionals took part in the Wall Street survey, 14 or 82% called for gold to rise, three votes or 18% thought gold would fall. The vote is calling for a sideways market. Meanwhile, 595 votes were cast on an online Main Street poll. Of those, 687 voters or 69% looked for gold to rise in the next week. Another 163 or 16% thought it would go lower, while 145 or 15% were neutral. In last week’s survey for the trading week now winding down, 59% of Wall Street voters and 67% of Main Street were bullish as of 11:20 am Eastern. It looks like the coronavirus risk is going to remain with us for the time being as it drives the sentiment of the market potentially to test that $1,600 to $1,610 area that we picked earlier in the month during the crisis between the United States and Iran.
As we move into the trading for next week, we saw bullish fundamental news about the coronavirus potentially impacting global economic activity, threatening a global slowdown and forcing central banks to be more aggressive on lowering interest rates even deeper, potentially bringing US rates into negative yields. In contrast, one of my concerns in the face of this bullish news and as the bullish sentiment continues to increase, is that in terms of supply and demand for gold, the price is moving into a very high probability area where we could find sellers or supply come into the market. The higher the price of gold around the $1,600 area. You have to be cautious if you are long the market for a potential reversion occurring from those levels. We remain long-term bullish on the metal, so we want to buy the corrections once the market adjusts after the most recent blowoff after the recent Iranian crisis. The ideal levels are for the market to come down to that $1,550 area, potentially to that $1,525 area.
The VC PMI Weekly Gold Forecast
Gold is trading last at $1,588. We use the artificial intelligence of our proprietary Variable Changing Price Momentum Indicator (VC PMI) to identify pivot points. Based on daily trading data, the price is above the mean of $1,586, so gold has activated a bullish price momentum. As a trader, using the VC PMI, we do not trade the average price because there's a 50/50 chance of it going up or down. We wait until the market comes down well below the mean, as it did, or well above to reach the Buy 1 or 2 levels or the Sell 1 or 2 levels, which have 90% and 95% probabilities of the market reverting from those levels back to the mean.
The artificial intelligence of the VC PMI tells you to wait for the highest probability trades, when the price closes, in this case on the 29th, above $1,580. Gold then activated a buy signal at 11:45 pm. If you took that signal, it automatically activated the target above of $1,586, which is a $600 profit.
(Click on image to enlarge)
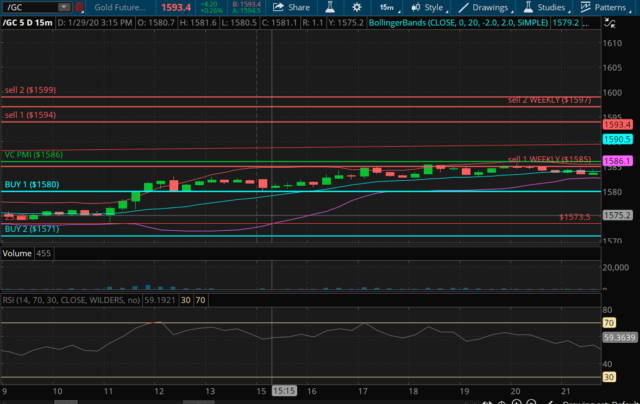
Courtesy: TDAmeritrade
On the right side of the chart are the weekly numbers. They do not change other than on Saturday. The daily numbers change each day and, if they go to an extreme, they transition into the weekly numbers.
On the weekly signals, we are in the red zone of Sell 1 of $1,585 to the Sell 2 of $1,597. We have a mixed signal in that the daily is activating a bullish price momentum and we are flat on the futures. The weekly signal has entered into what we call an area of distribution of supply. In this case, the VC PMI tells us that if the price closes above this level, do not buy. Why? If the price is activated at the Sell 1 level, there's only a 10% probability of the market continuing to rise. There's a 90% chance that the market will revert from Sell 1 to the mean. The market could go up, but it's far better to play the odds and stay neutral. We are waiting for the price to either go up to $1,594, the daily Sell 1 level, or up to $1,597 to $1,599 and activate a short trigger.
Gold also might close below $1,586, it would activate a bearish price momentum and a short trigger weekly on a close below $1,585. It would be a very strong bearish signal.
STRATEGY for week of Feb. 3, 2020
Summary
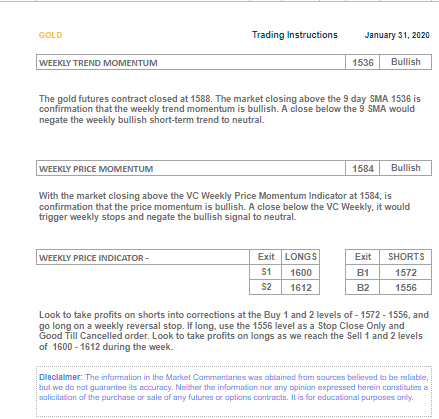
The weekly price momentum of 1536 is bullish.
The weekly VC PMI of 1584 is bullish.
A close below 1584 stop, negates this bullishness neutral.
If long cover position 1600 - 1612.
(Click on image to enlarge)
Disclosure: I am/we are long DUST. I wrote this article myself, and it expresses my own opinions.
To learn more about how the VC PMI works and receive weekly reports on the E-mini, gold and ...
more

