
Gold Need Consumer Sentiment To Tank
Overall, it looks like the US economy is trying to recover. The Fed moved too far with interest rates and did an about-face early this year. The stock markets are nearing their 2018 highs, and some stocks have already broken out. At the moment, I think the US postponed a recession.
The economic data I monitor was skewed dramatically by the government shutdown and plunging stock market late last year. It’s been difficult to gauge the true employment and manufacturing numbers. On the surface, it looks like most of those aggregates have stabilized.
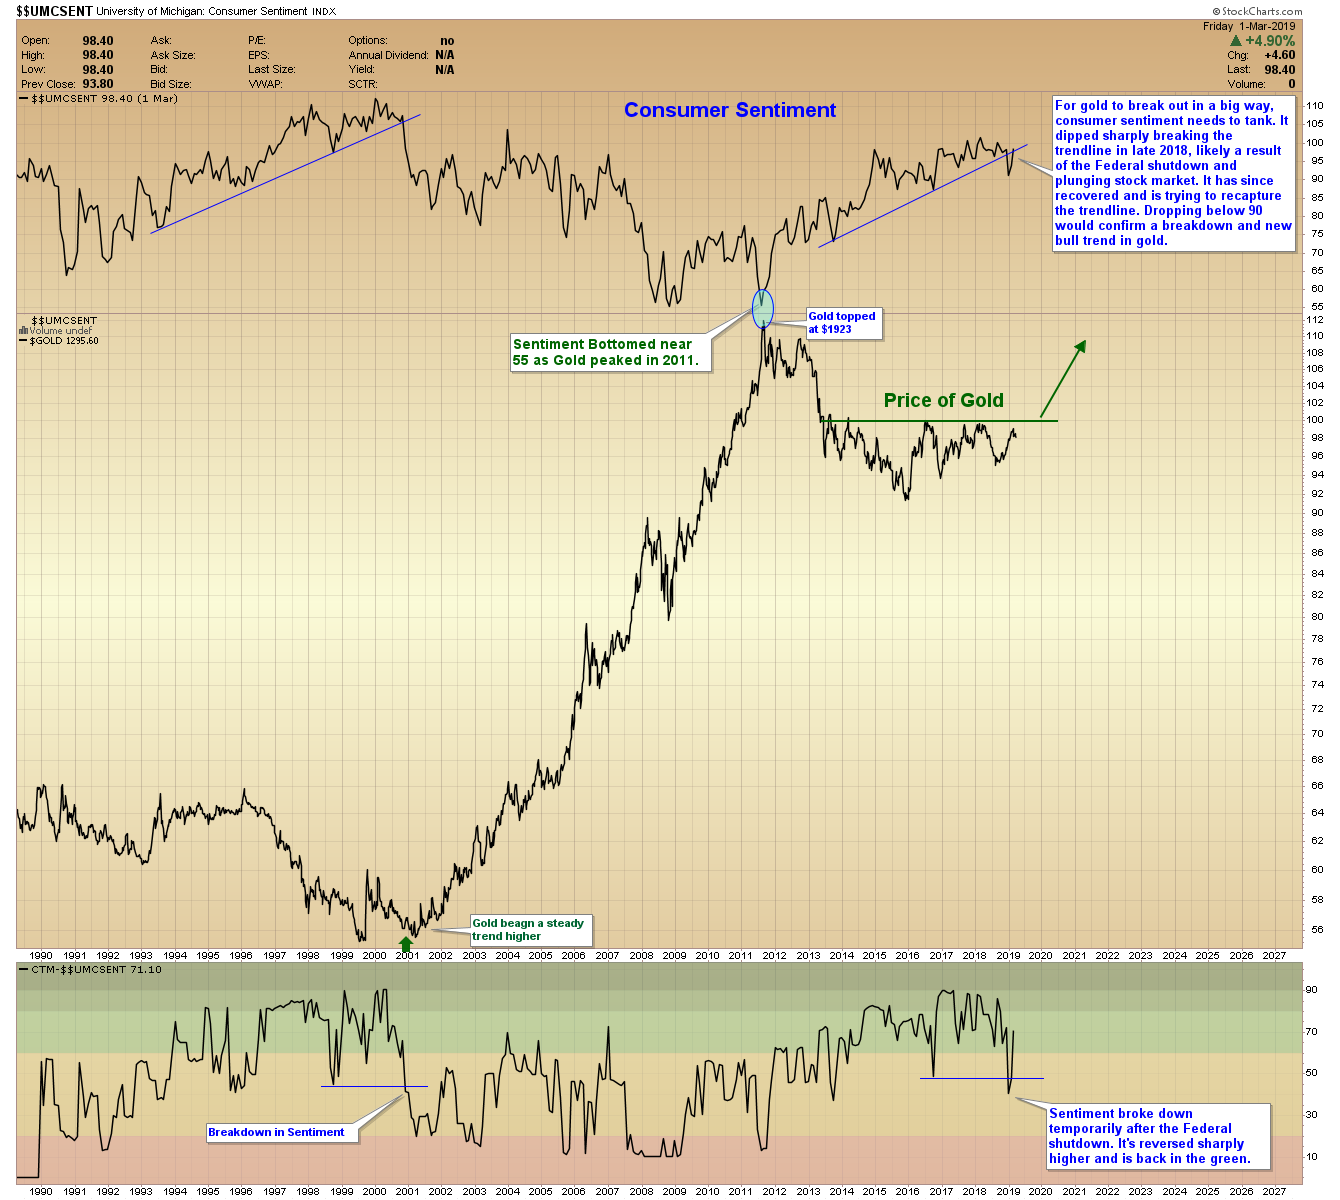
For example, consumer sentiment crashed late last year reaching a value of 91. That 10% plunge broke the multi-year trendline. It looked like a legitimate breakdown. Values have since stabilized and are once again approaching the 100 level (see chart below).
CONSUMER SENTIMENT
For gold to break out in a big way, consumer sentiment needs to tank. It dipped sharply breaking the trendline in late 2018, likely a result of the Federal shutdown and plunging stock market. It has since recovered and is trying to recapture the trendline. Dropping below 90 would confirm a breakdown and new bull trend in gold.
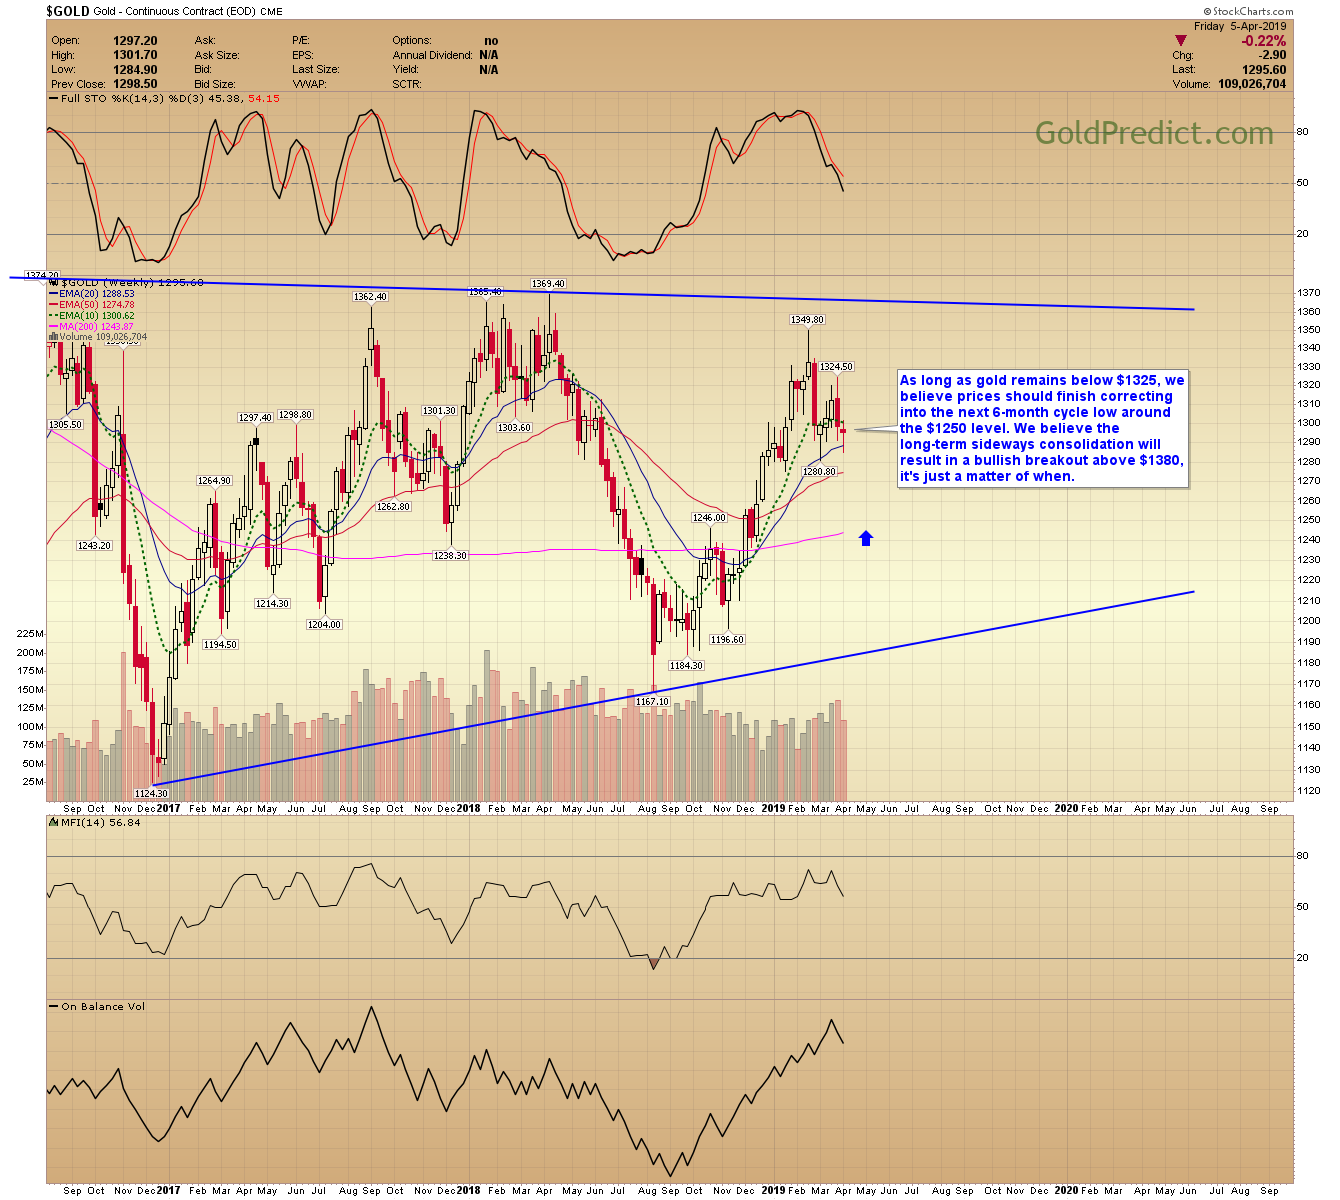
GOLD WEEKLY
As long as gold remains below $1325, we believe prices should finish correcting into the next 6-month cycle low around the $1250 level. We believe the long-term sideways consolidation will result in a bullish breakout above $1380; it’s just a matter of when.
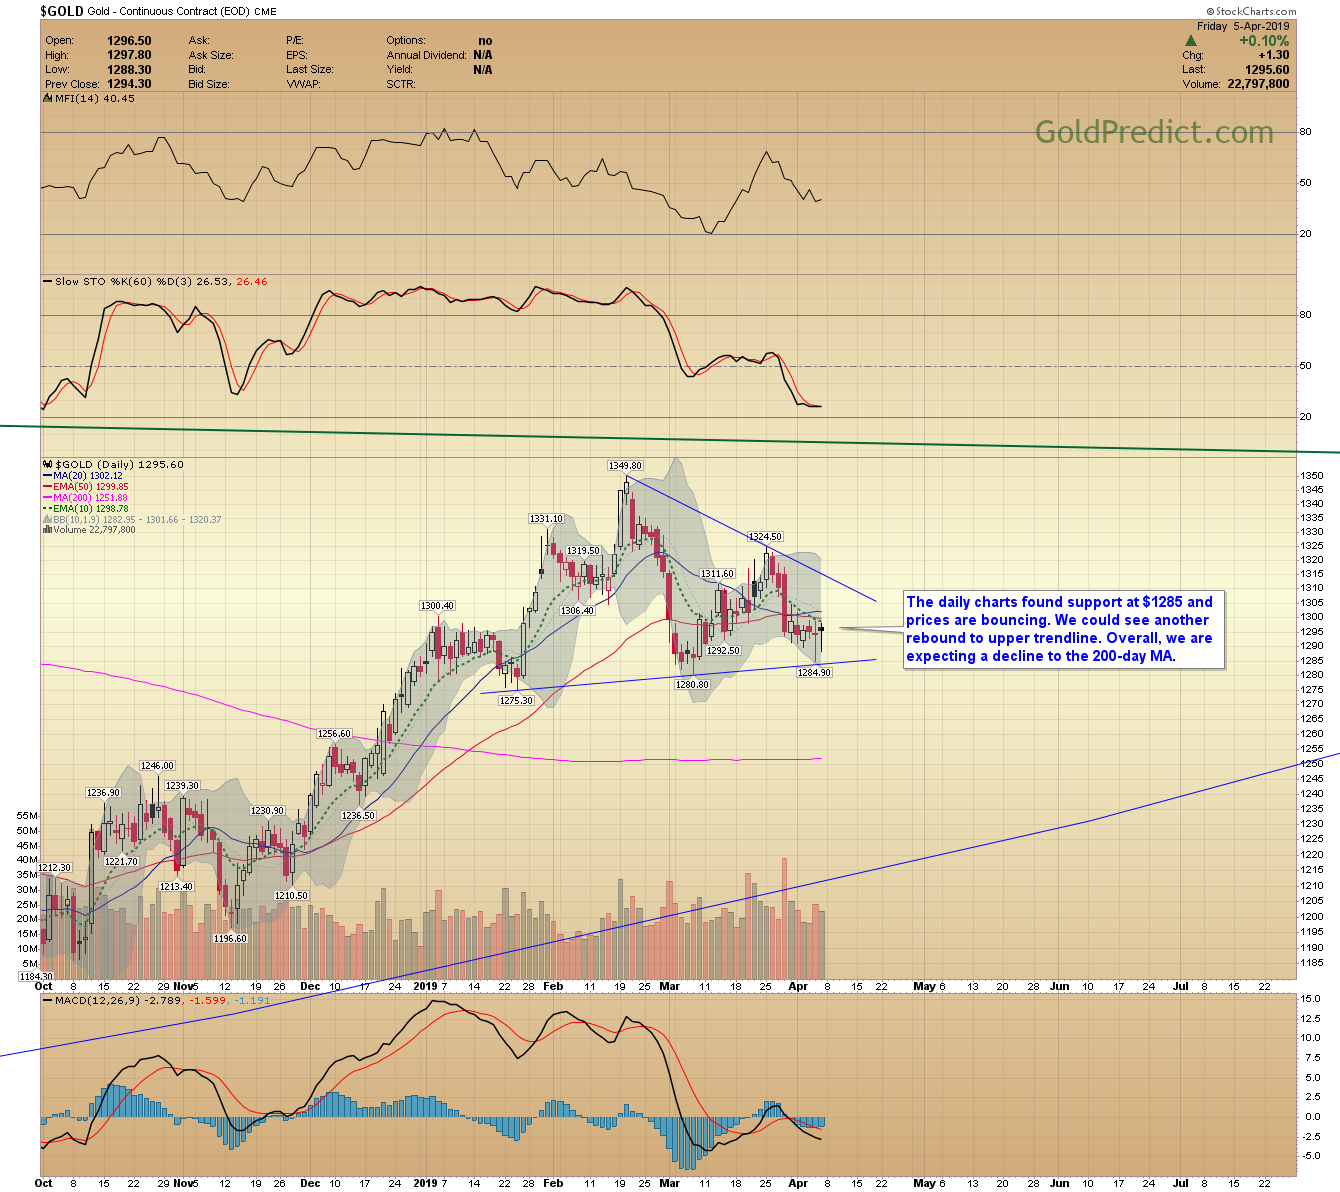
GOLD
The daily chart found support at $1285 and prices are bouncing. We could see another rebound to upper trendline. Overall, we are expecting a decline to the 200-day MA.
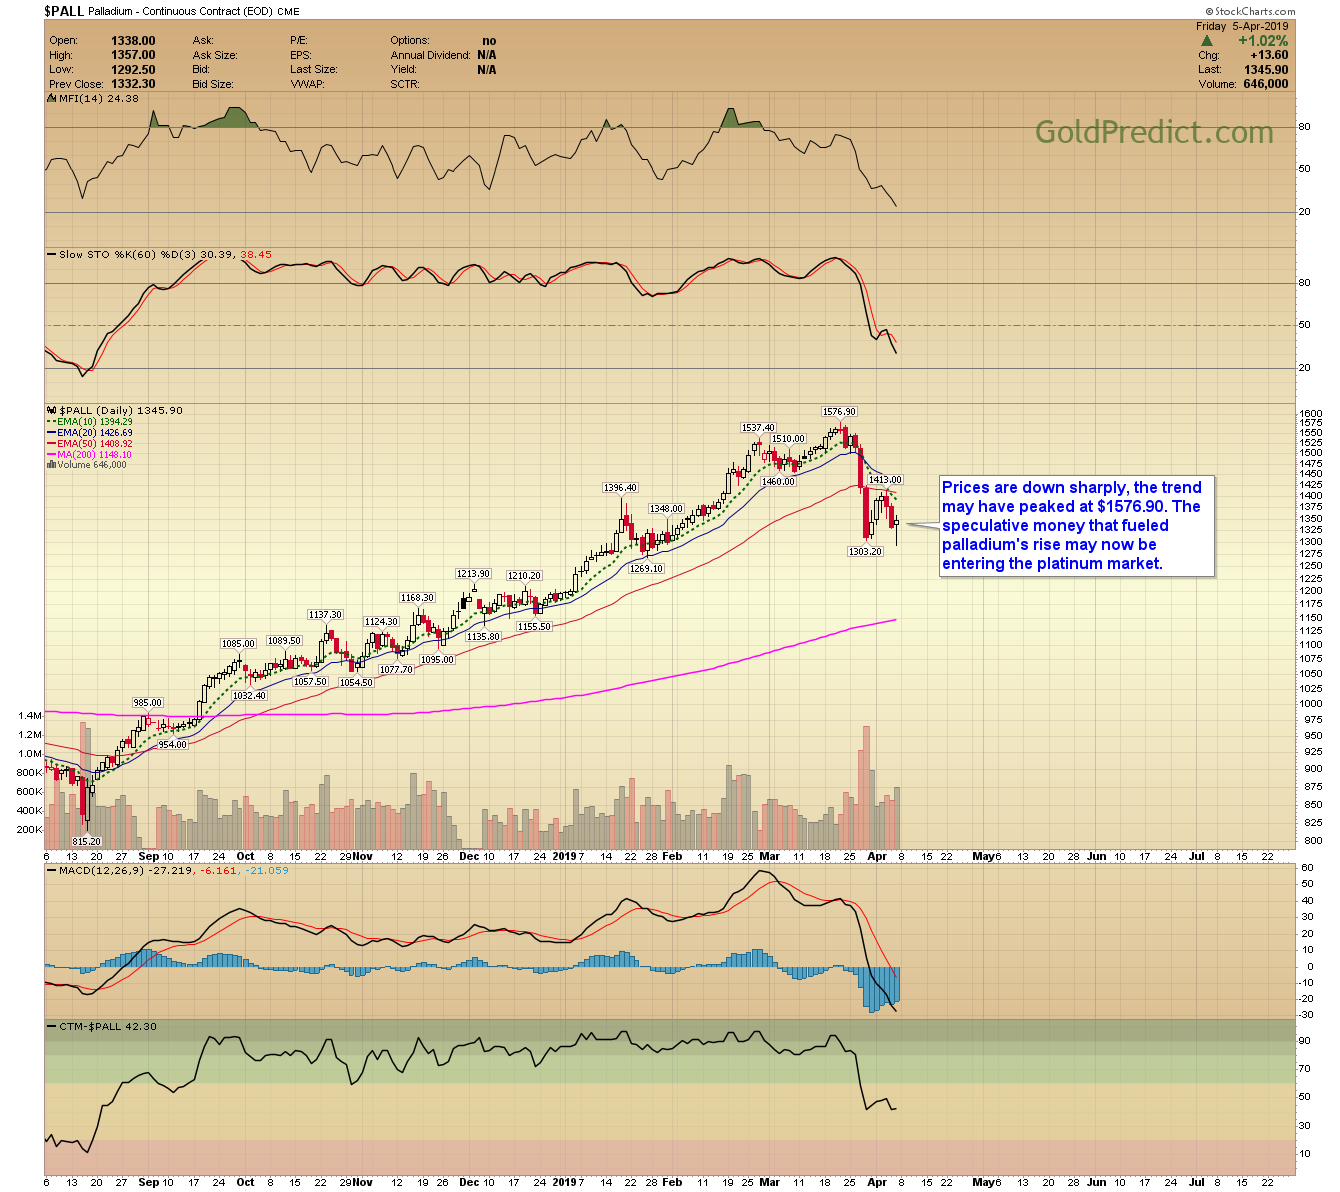
PALLADIUM
Prices are down sharply, the trend may have peaked at $1576.90. The speculative money that fueled palladium’s rise may now be entering the platinum market.
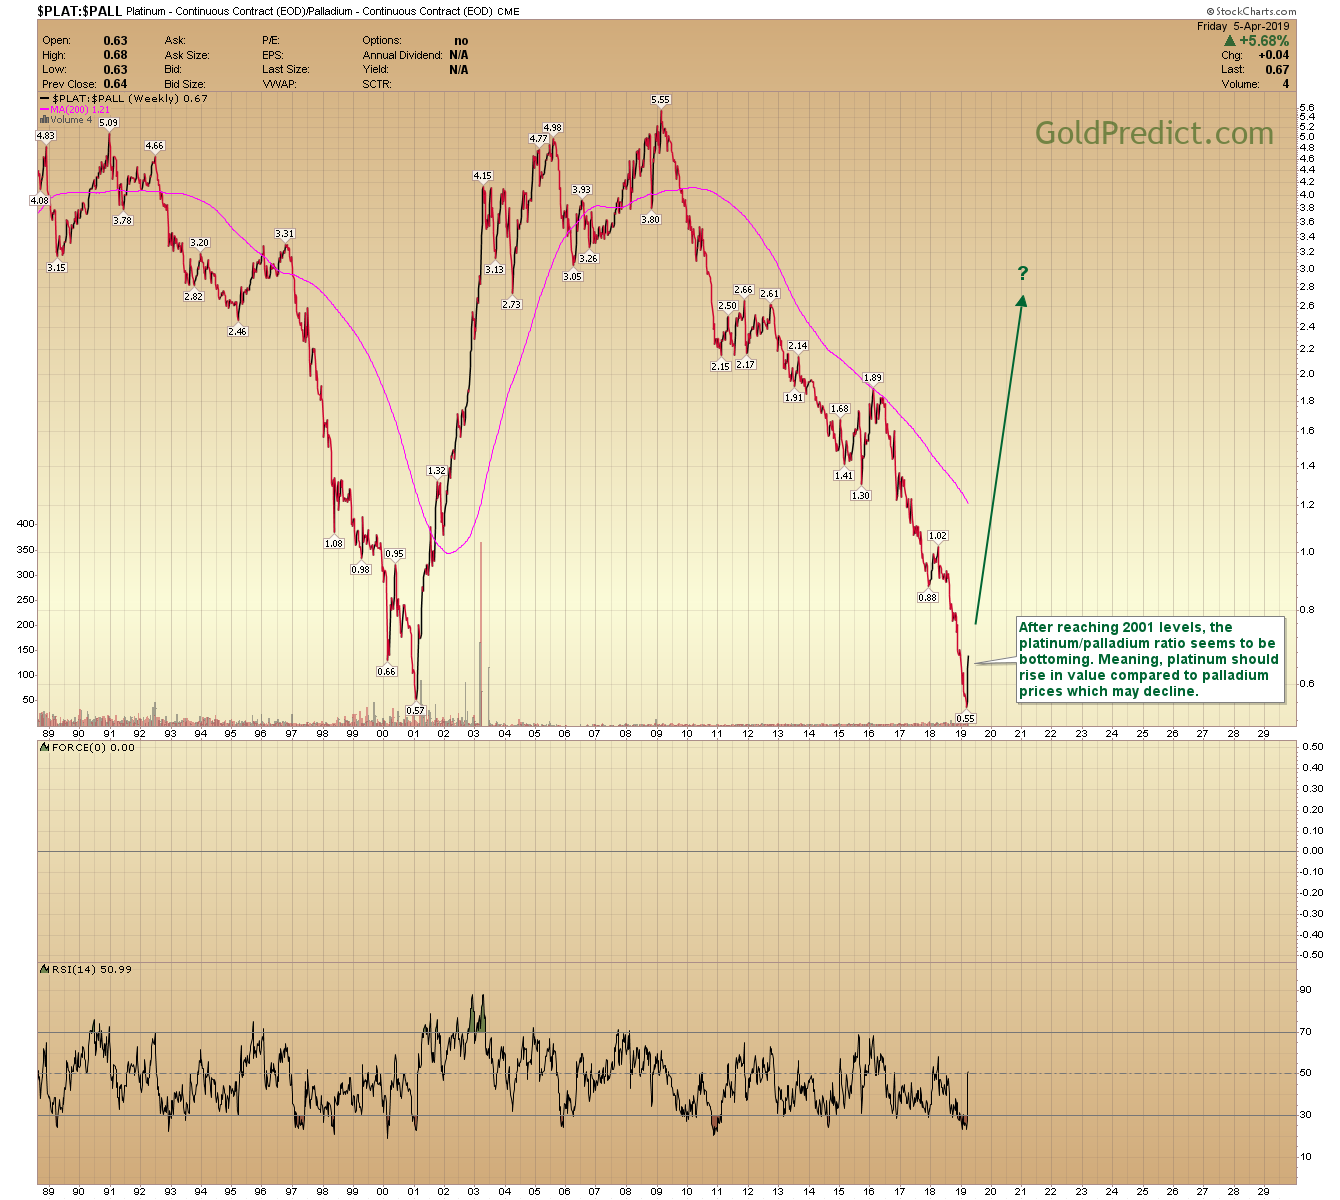
PLATINUM VS. PALLADIUM RATIO
After reaching 2001 levels, the platinum/palladium ratio seems to be bottoming. Meaning, platinum should rise in value compared to palladium which may decline.
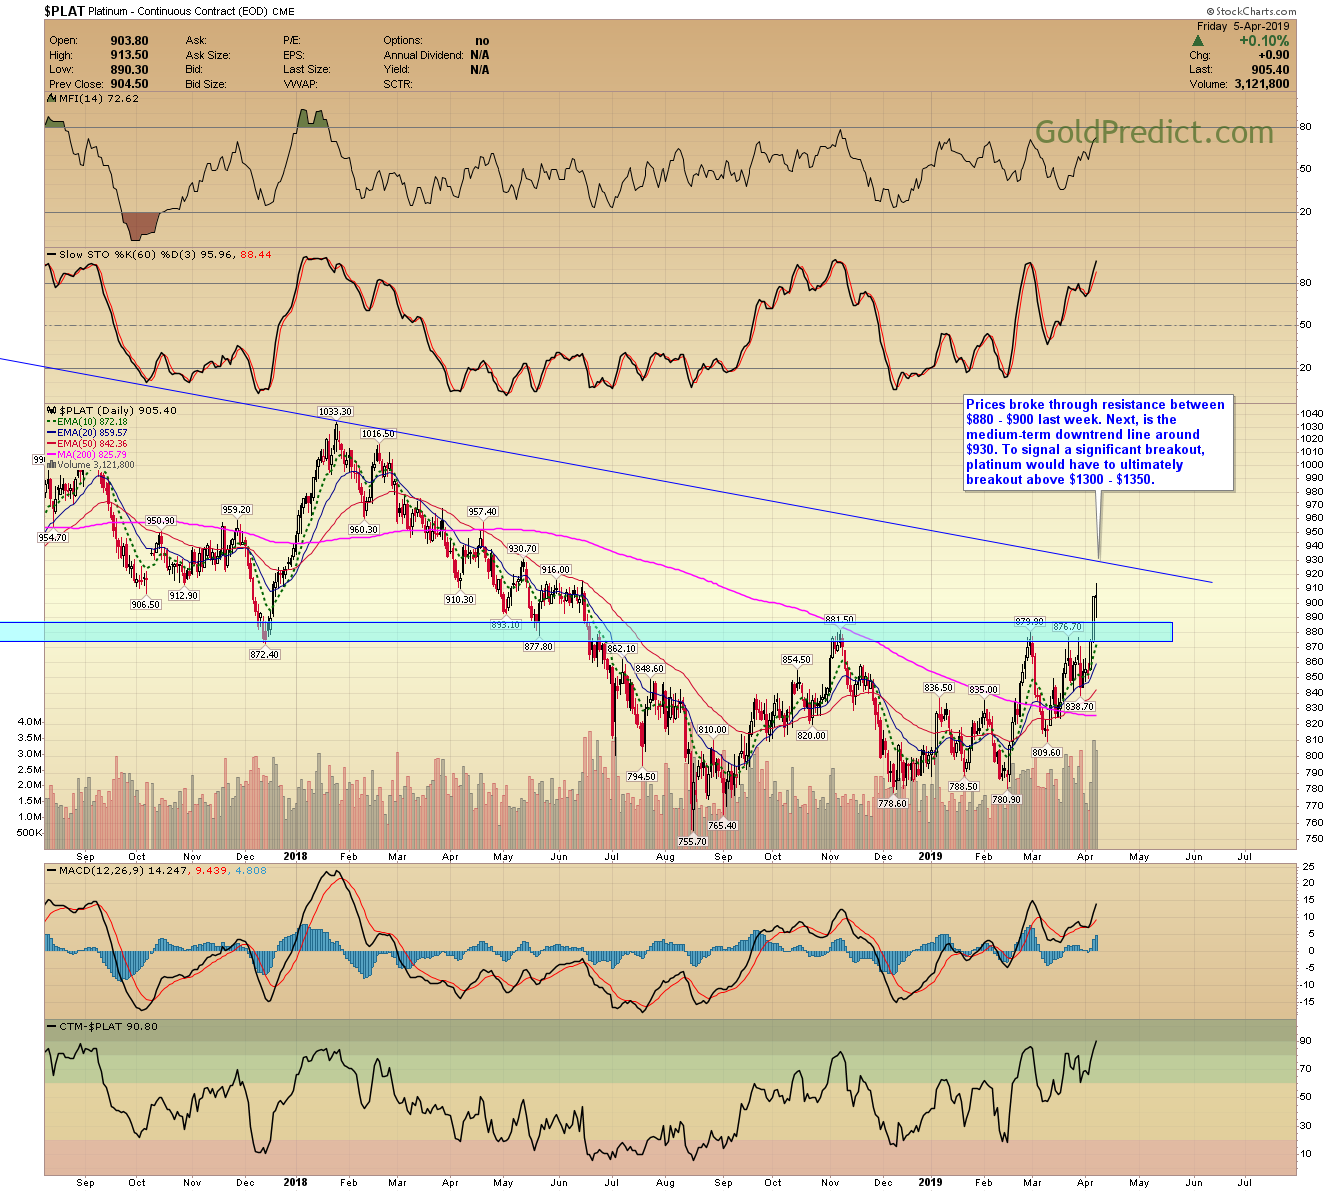
PLATINUM
Prices broke through resistance between $880 – $900 last week. Next, is the medium-term downtrend line around $930. To signal a significant breakout, however, platinum would have to ultimately breakout above $1300 – $1350.
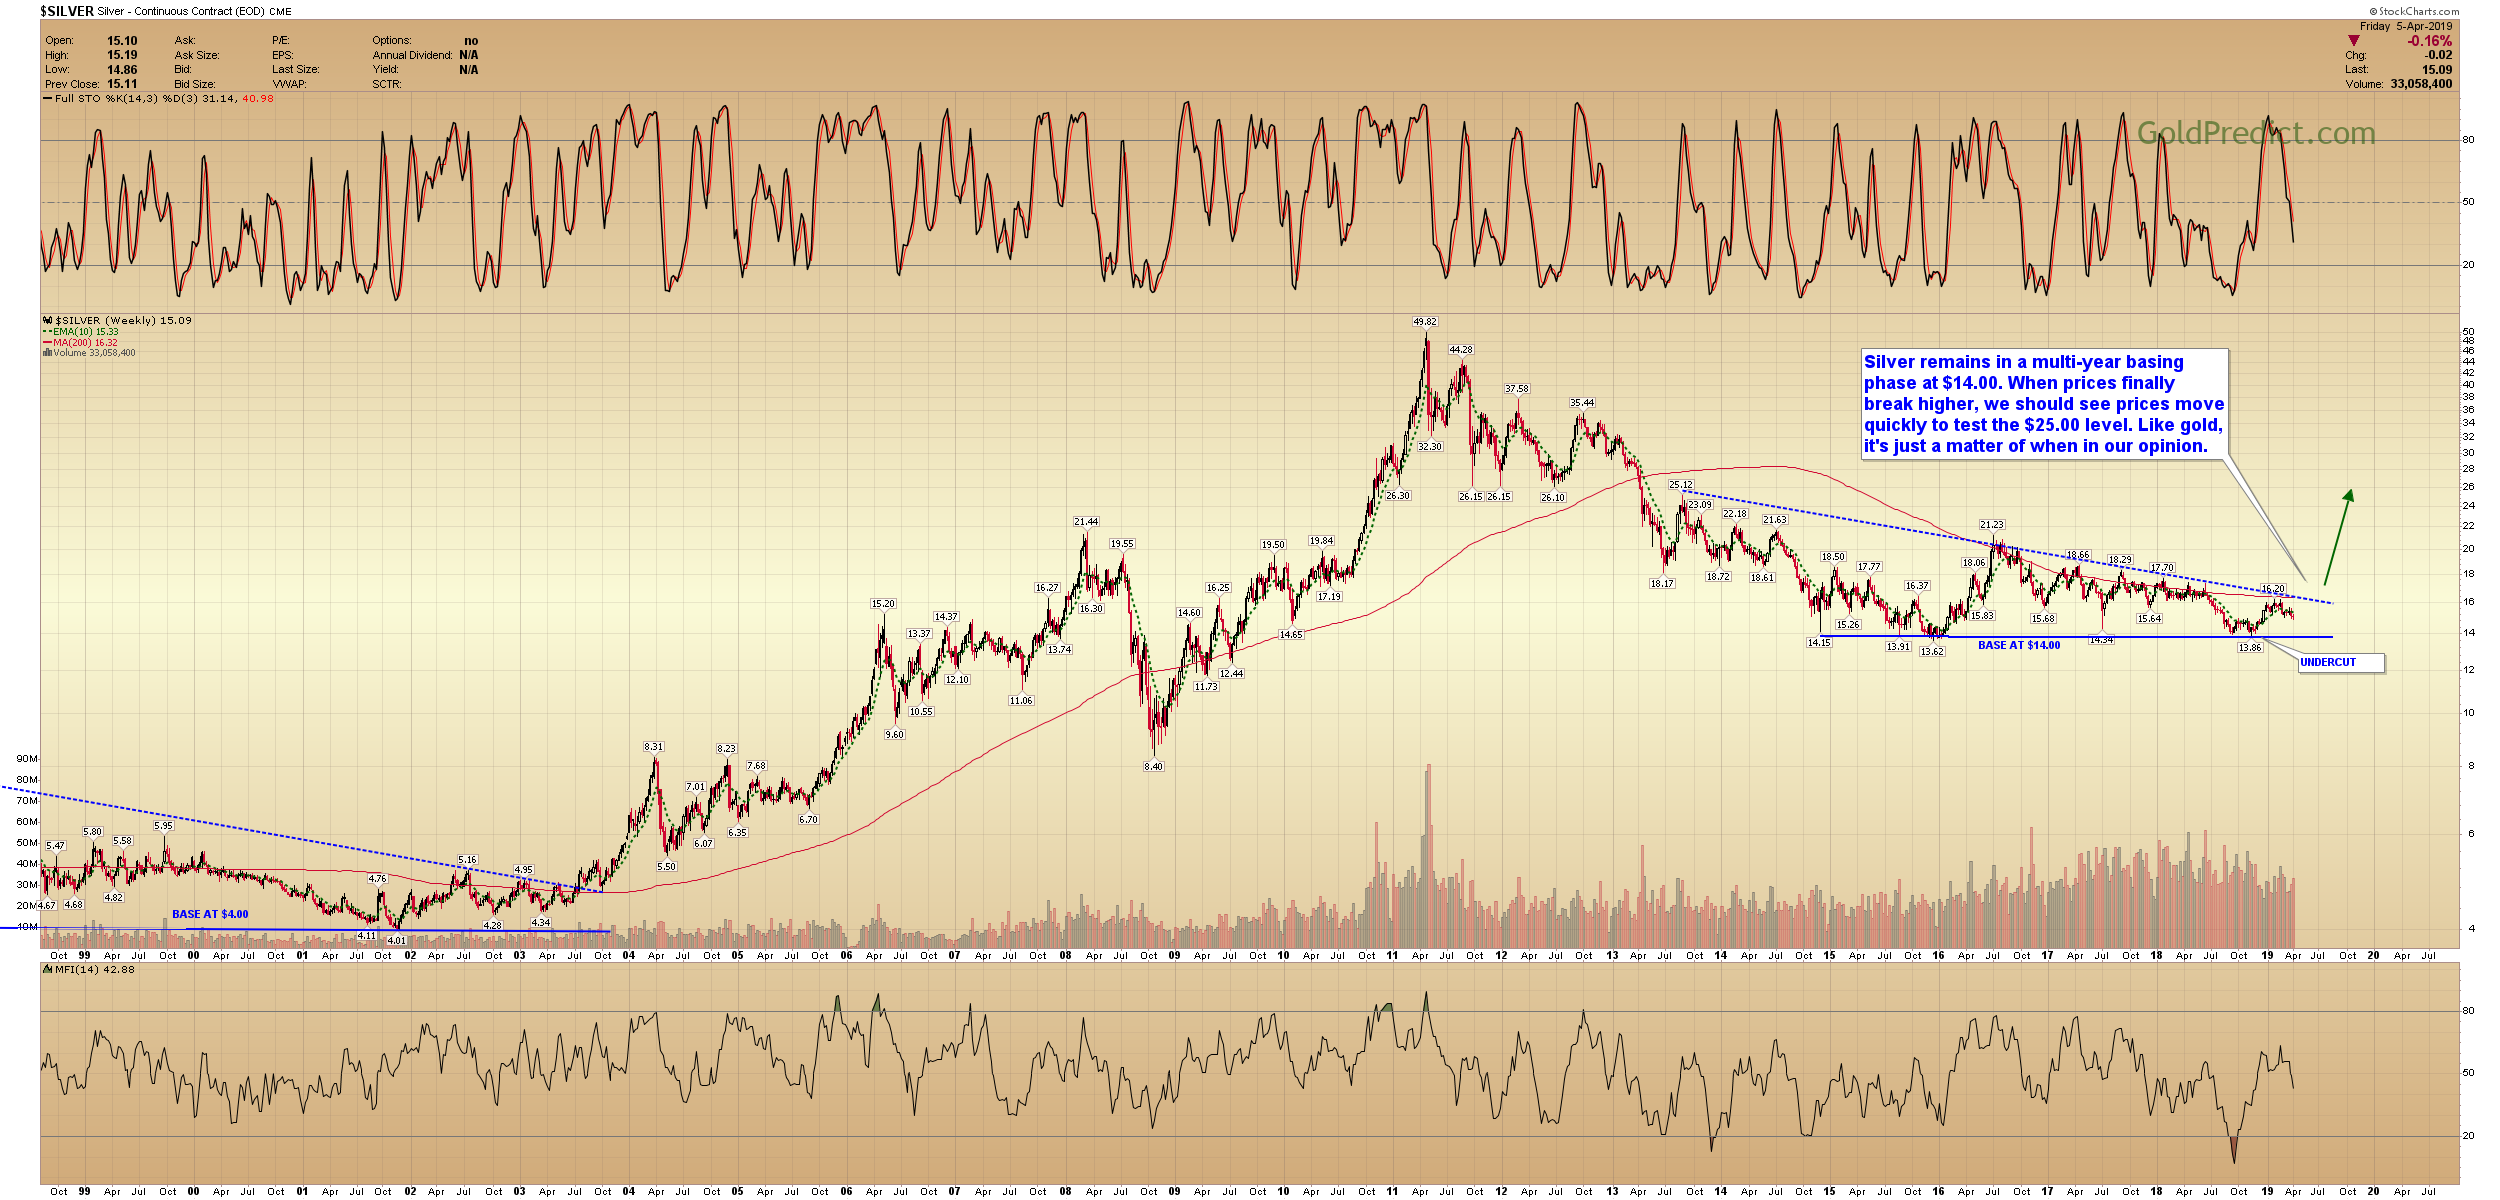
SILVER
Silver remains in a multi-year basing phase near $14.00. When prices finally break higher, we should see prices move quickly to test the $25.00 level. Like gold, it’s just a matter of when in our opinion.
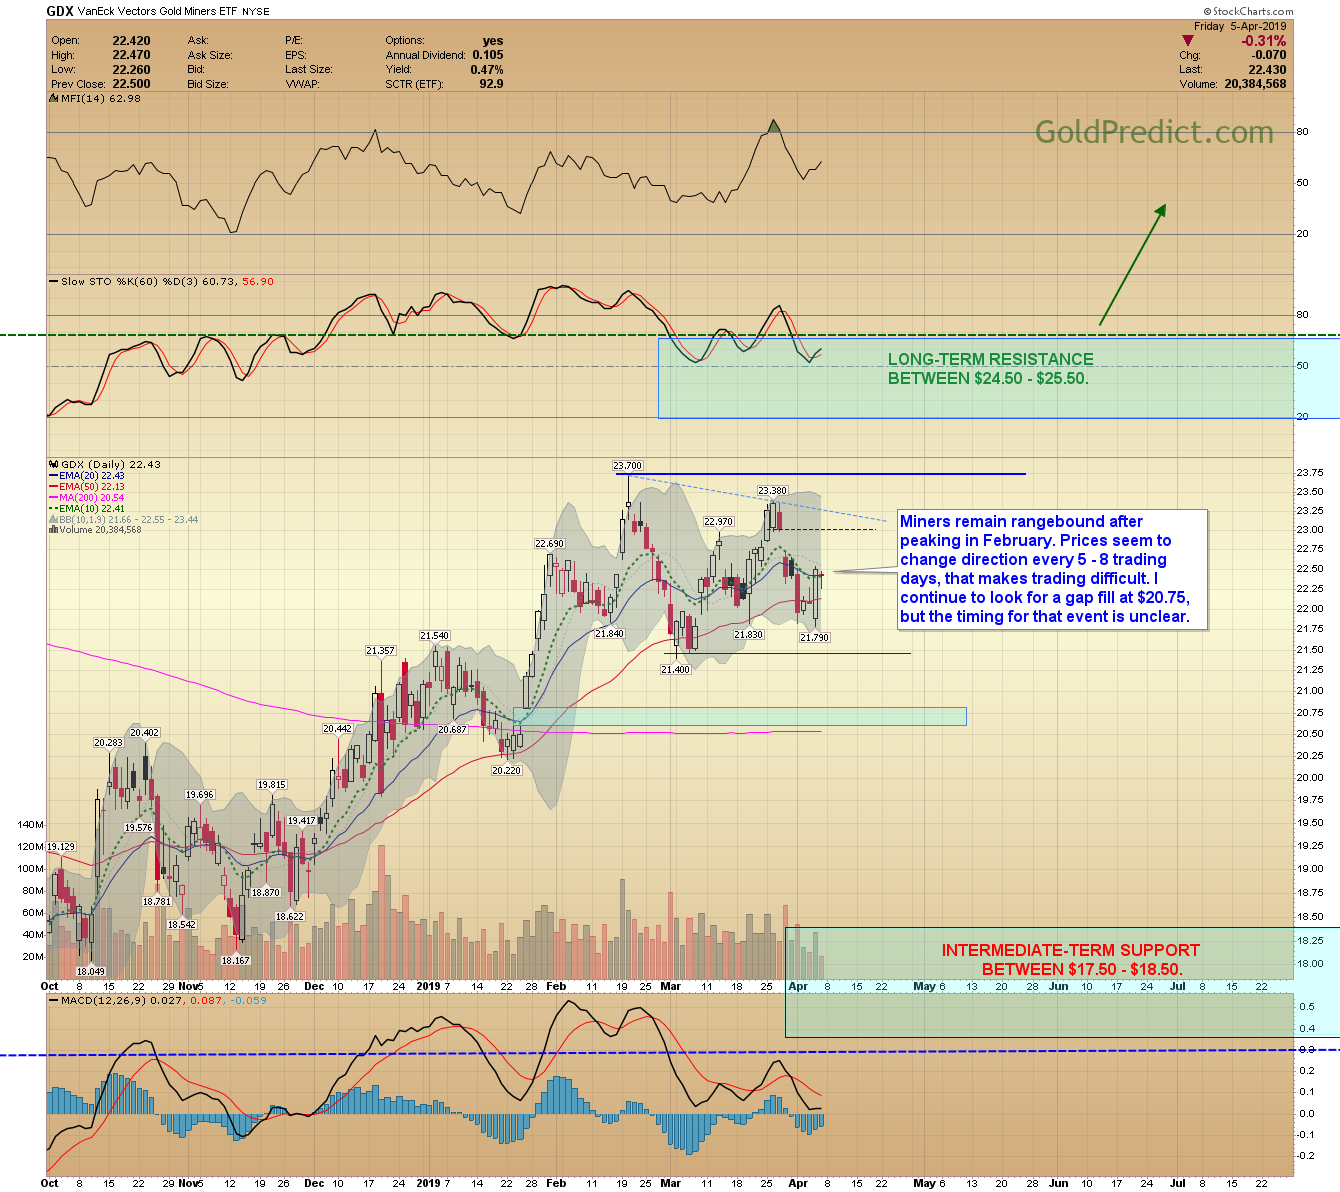
Miners remain rangebound after peaking in February. Prices seem to change direction every 5 – 8 trading days, that makes trading difficult. I continue to look for a gap fill at $20.75, but the timing for that event is unclear.
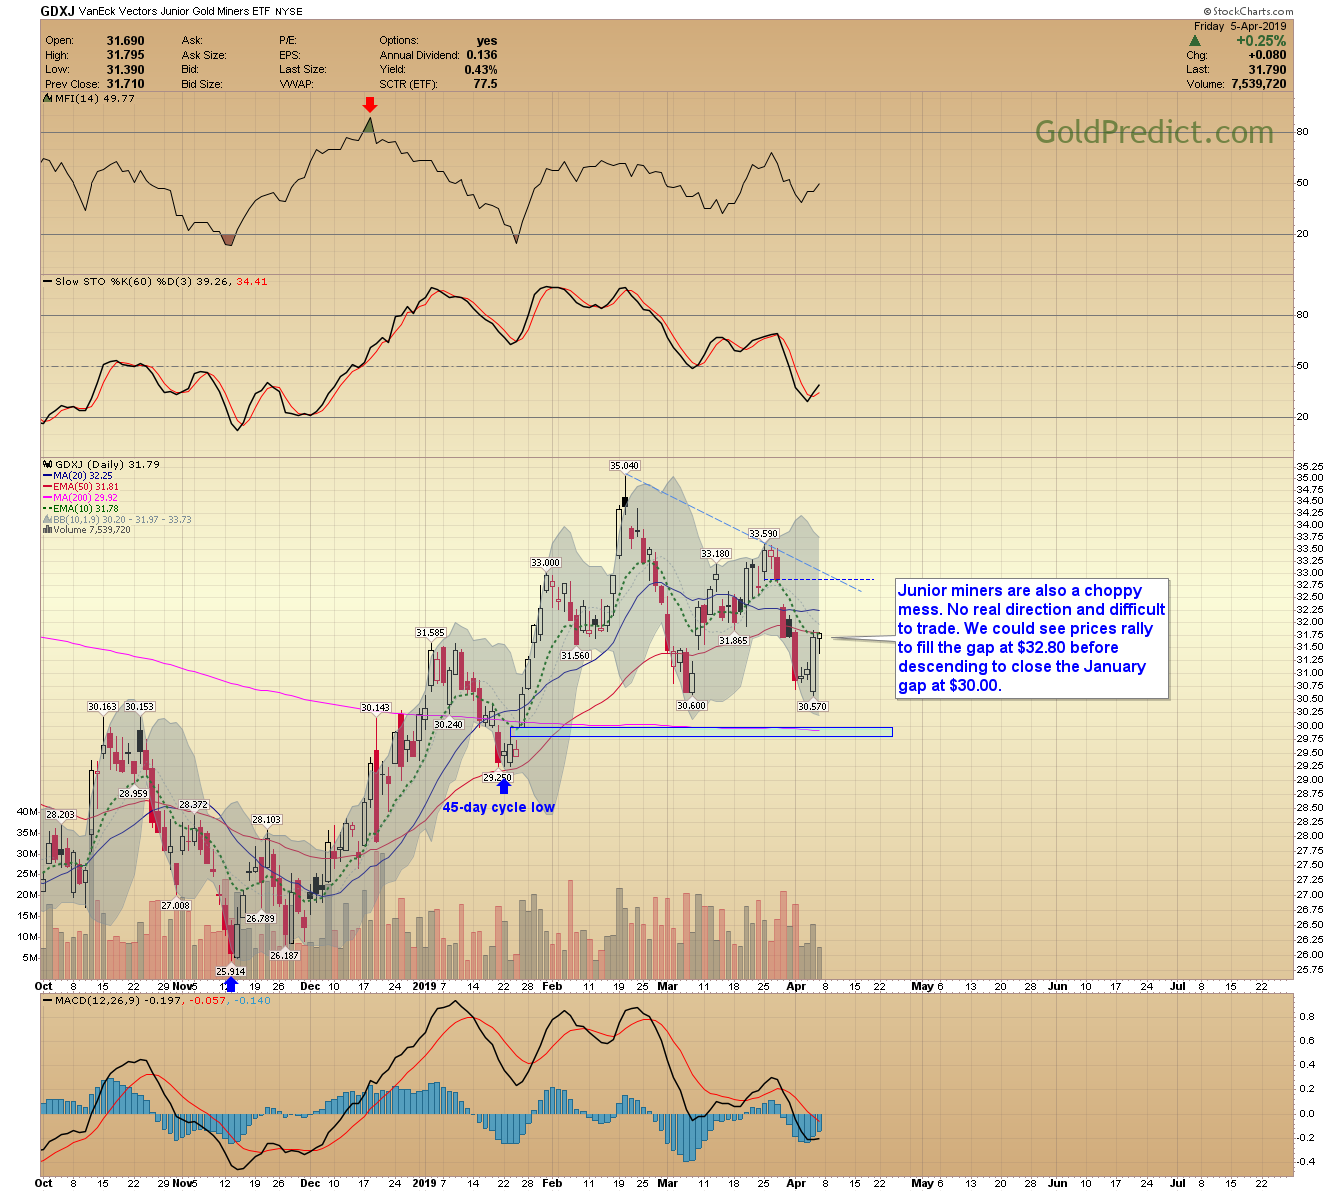
Junior miners are also a choppy mess. No real direction and difficult to trade. We could see prices rally to fill the gap at $32.80 before descending to close the January gap at $30.00.
-
WTIC MONTHLY
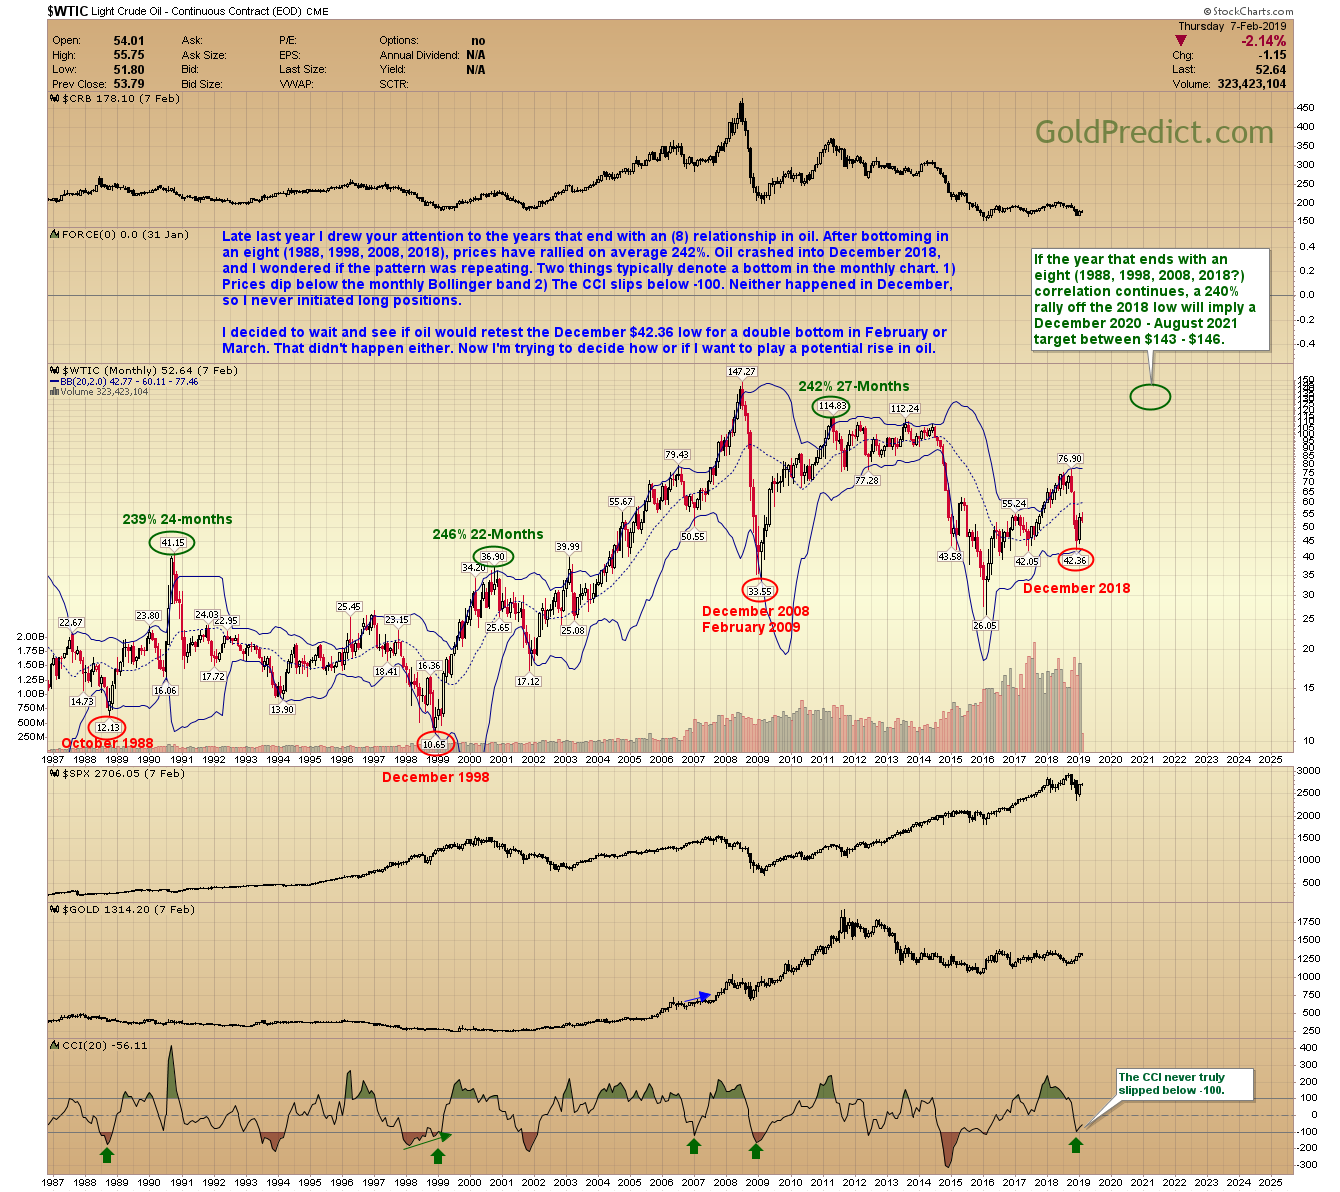
Late last year I drew your attention to the years that end with an (8) relationship in oil. After bottoming in an eight (1988, 1998, 2008, 2018), prices have rallied on average 242%. Oil crashed into December 2018, and I wondered if the pattern was repeating. Two things typically denote a bottom in the monthly chart. 1) Prices dip below the monthly Bollinger band 2) The CCI slips below -100. Neither happened in December, so I never initiated long positions.
I decided to wait and see if oil would retest the December $42.36 low for a double bottom in February or March. That didn’t happen either. Now I’m trying to decide how or if I want to play a potential rise in oil.
If the year that ends with an eight (1988, 1998, 2008, 2018?) correlation continues, a 240% rally off the 2018 low will imply a December 2020 – August 2021 target between $143 – $146.
Oil over $140 is a big leap from here. My initial reaction views this as unlikely, for a couple of reasons. First, hydraulic fracking is much more of a factor than it has been in the past. US producers can ramp up production quickly at higher prices. Second, typically higher prices equal increased global demand, and I don’t see economic growth exploding anytime soon. So to reach such lofty targets, oil probably needs something to cause significant supply constraints, such as geopolitical issues. Possibly, I guess with what’s occurring in Venezuela.
So is $140+ oil possible? Sure – anything’s possible. Is $140 oil likely? It’s a long-shot for sure. Nevertheless, to play the potential for $140+ oil, I’ve decided to buy (DNR). That way I have some exposure to the possibility of much higher oil prices.
DNR (Denbury Resources)
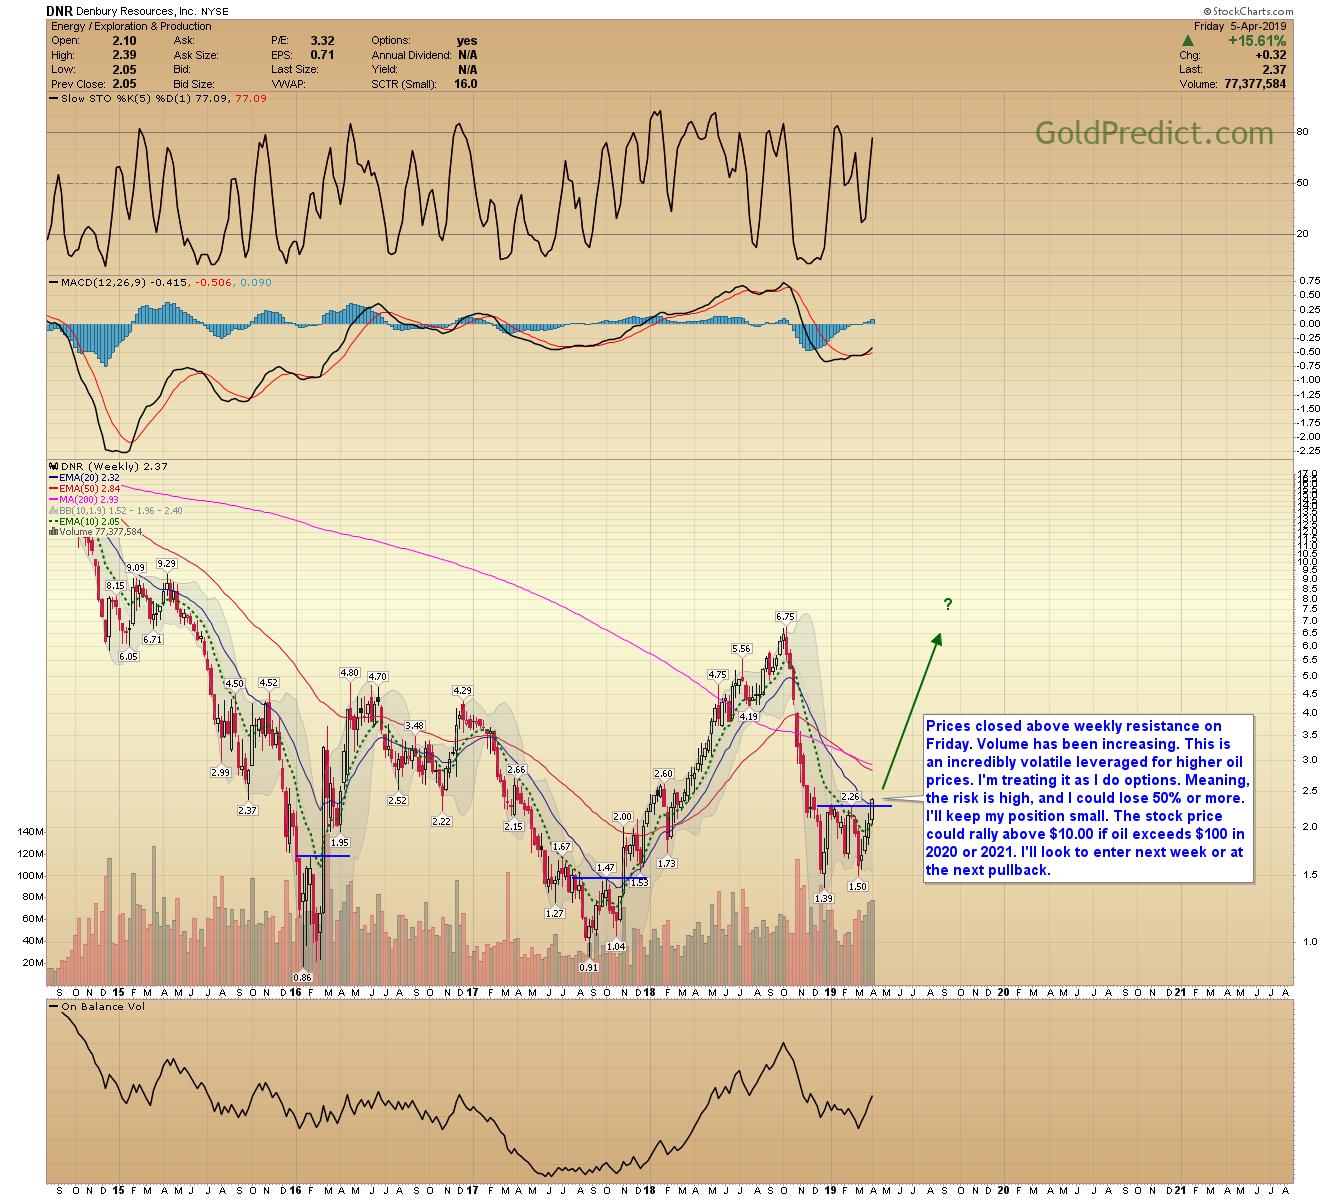
Prices closed above weekly resistance on Friday. Volume has been increasing. This is an incredibly volatile stock leveraged for higher oil prices. I’m treating it as I do options. Meaning, the risk is high, and I could lose 50% or more. I’ll keep my position small. The stock price could rally above $10.00 if oil exceeds $100 in 2020 or 2021. I’ll look to enter next week or at the next pullback.
S&P 500 WEEKLY
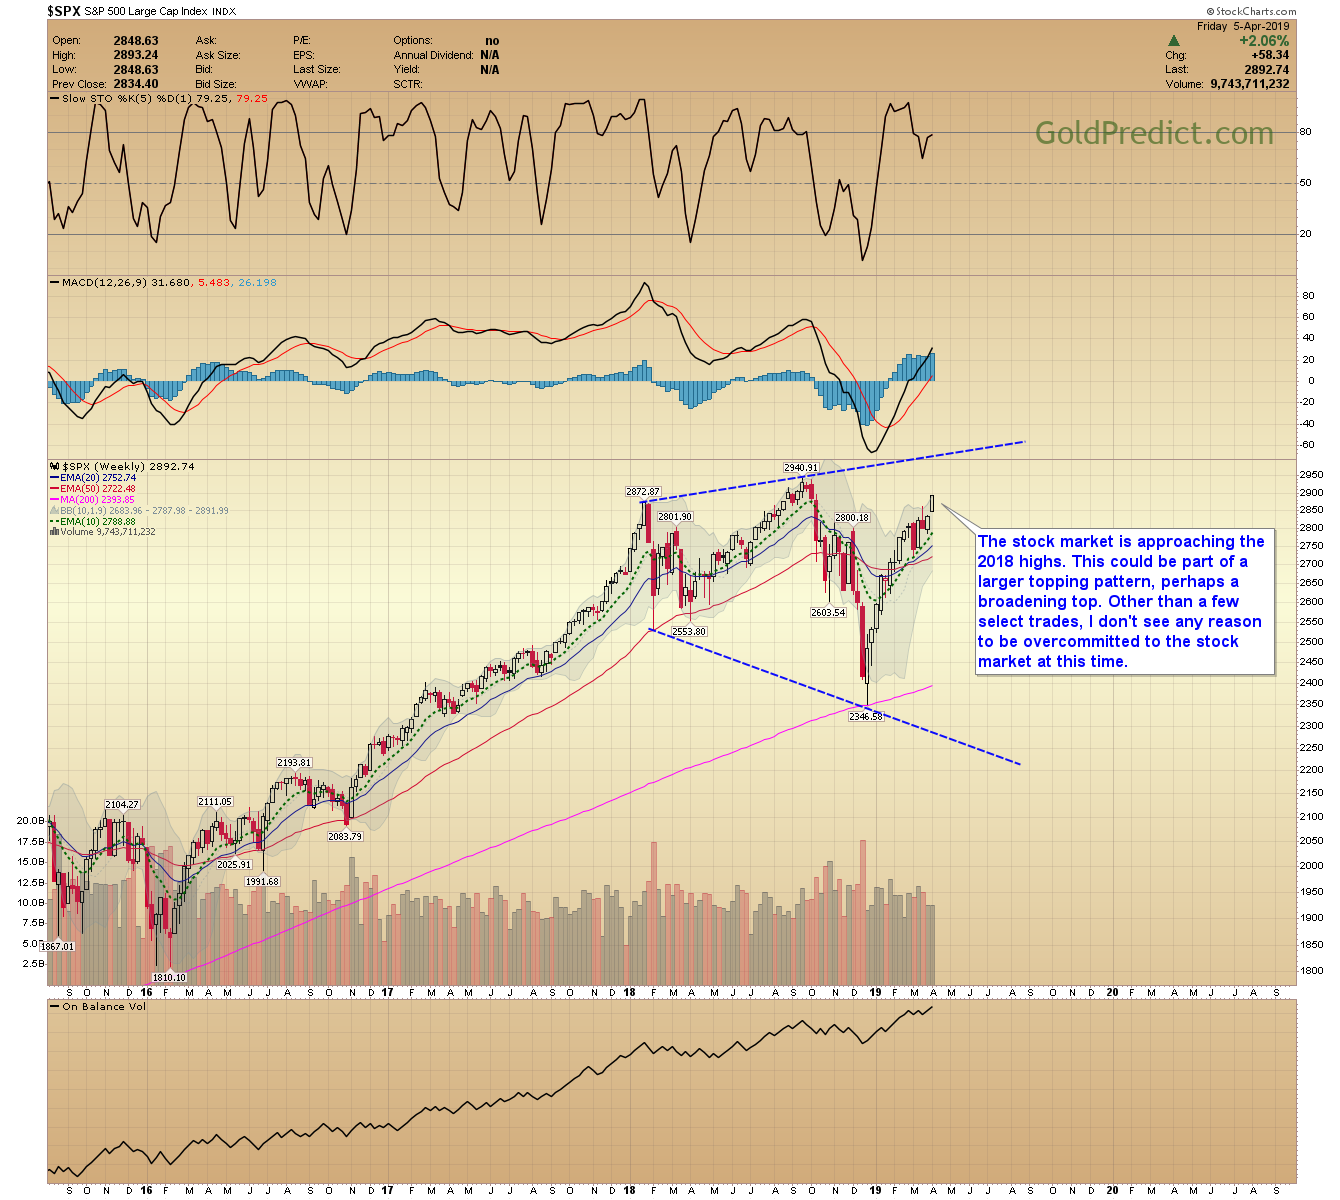
The stock market is approaching the 2018 highs. This could be part of a larger topping pattern, perhaps a broadening top. Other than a few select trades, I don’t see any reason to be overcommitted to the stock market at this time.
GOLD

HOLD – NEUTRAL
SILVER
HOLD – NEUTRAL
SENIOR MINERS
HOLD – NEUTRAL
JUNIOR MINERS
HOLD – NEUTRAL
Disclosure: None.


