Gold: Monetary Expansion Likely To Drive Prices Higher From Here
With stocks flying high, Bitcoin (BTC-USD), and other digital assets skyrocketing left and right, it seems that many market participants have essentially forgotten about gold. In fact, given the current economic backdrop gold is arguably cheap. Nevertheless, you would never guess this from the price action, as the "gold trade" seems to be deeply hated right now. Likewise, if we look at gold mining companies, some are simply trading at rock bottom valuations.
Is Gold Cheap Right Now?
Putting a precise price tag on gold is somewhat difficult. Do you look at the dollar index, key bond yields, inflation, Fed policy? To get a better understanding we will look at several key metrics, but first, let's look at a chart of gold.
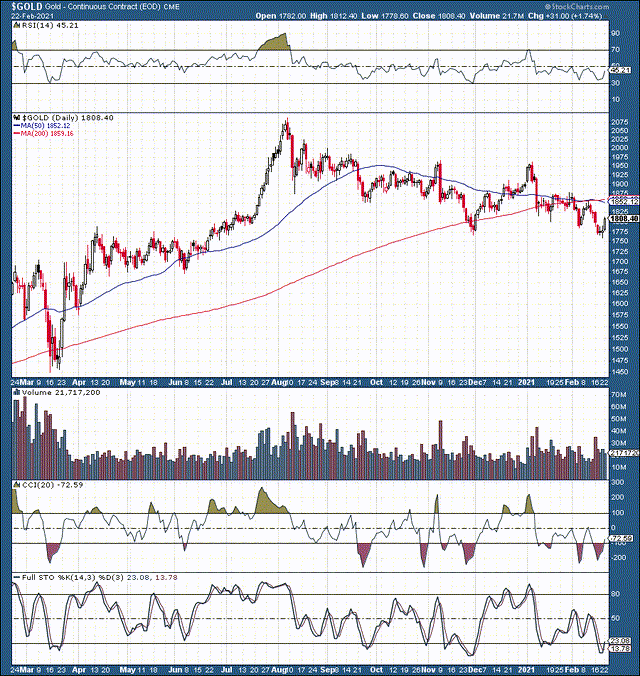
Gold 1-year chart
Source: Stockcharts.com
We see that gold has been in a downward trending channel for nearly 7 months now. Furthermore, we can see that at around $1,750 gold has a crucial support level, a point it consolidated at previously before making a run at its all-time highs above $2,000.
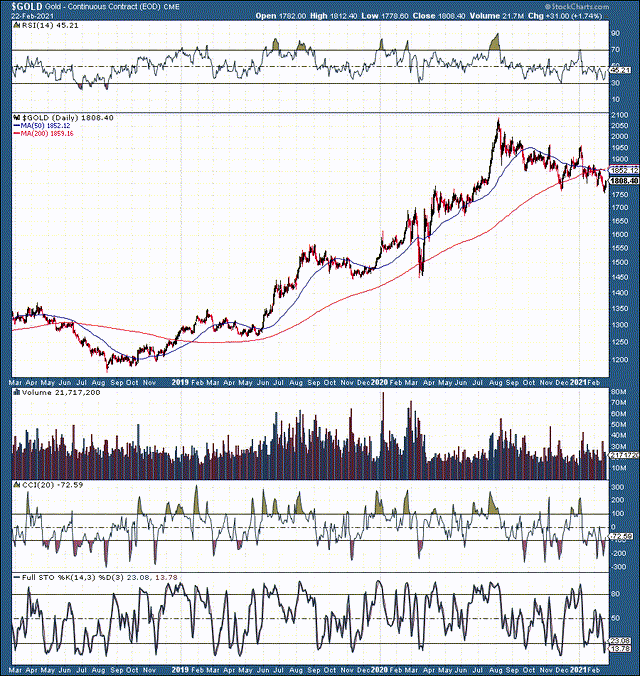
Gold 3-year chart
If we look at the 3-year chart of gold we see that the precious metal has had several similar correction type periods in the past following steep run-ups. Granted this latest decline has been longer than prior consolidation/pullback phases. Nevertheless, the push towards new all-time highs (ATHs) was also quite vertical relative to prior ascends. In addition, the RSI shot up to approximately 90 for the first time in a number of years, illustrating extremely overbought technical conditions for gold at the time. Therefore, it is not terribly surprising that the recent correction phase is taking longer to conclude than previous such events.
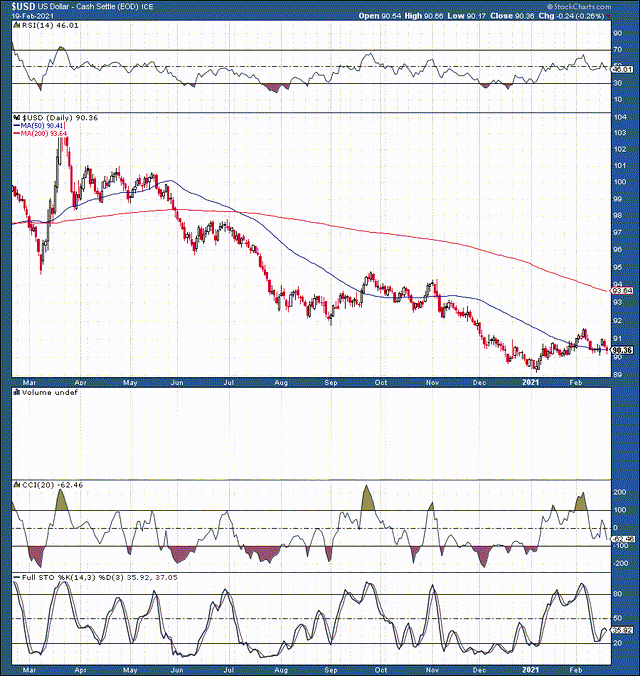
USD 1-year chart
The dollar index is lower than where it was in August when gold peaked. Thus, we see both the dollar and gold decline in tandem over the last several months.
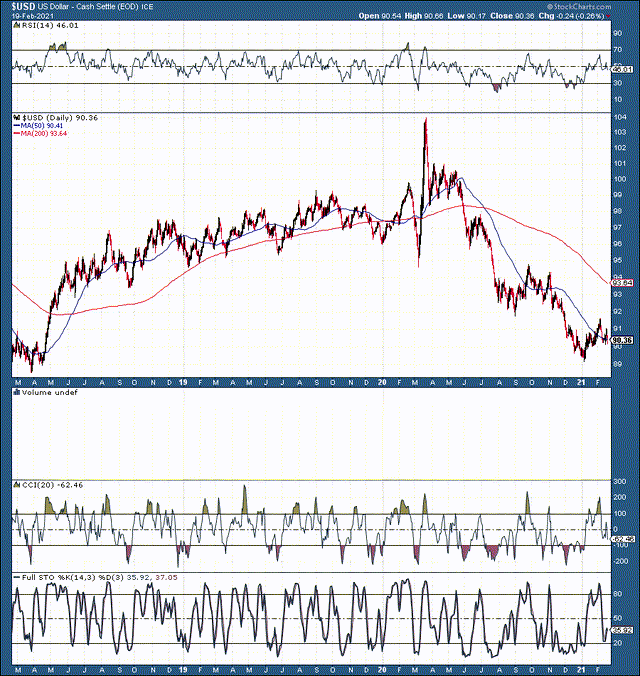
USD 3-year chart
The dollar index is essentially back to where it was 3 years ago, while gold has made substantial gains over the last several years. Despite the short-term correlation the dollar and gold prices show at times these charts illustrate that intermediate and longer-term this correlation is far less pronounced.
Let's look at rates
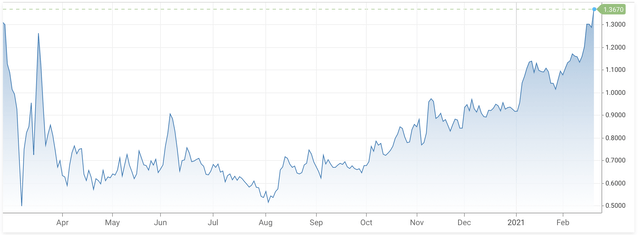
10-Year Treasury 1-year chart
Source: CNBC.com
We see that the 10-year has made some significant gains lately. Moreover, we can also see that the key benchmark bottomed in early August, coinciding with gold's top. However, we see that while the 10-year is essentially back to where it was 1 year ago, gold is up by roughly 15% over the same time frame. Thus, we see some correlation here on a shorter-term basis.
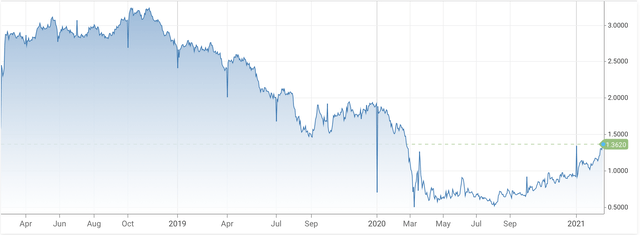
10-Year Treasury 3-year chart
Here we also see some correlation. The 10-year peaked around October 2018, and this was incidentally the low for gold over the last 3 years. Then we see a steady decline in yields for the 10-year, while gold makes new highs. But, how high can yields go, realistically?
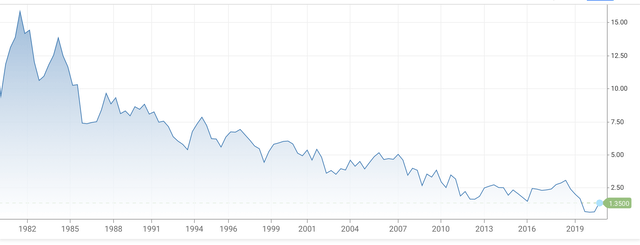
10-Year Treasury long-term chart
Here's a long-term chart of the 10-year, and we see a clear trend lower and lower here. Due to massive debt on all fronts (government, consumer, corporate, student loan, etc.) the economy is not able to function efficiently or grow in a "normalized", moderately higher interest rate environment. We witnessed this first hand in 2018 when the Fed attempted to bring up its benchmark rate along with some modest QT. The economy simply could not sustain growth and the Fed had to back away from its tightening stance to avoid a serious economic meltdown.
Inflation
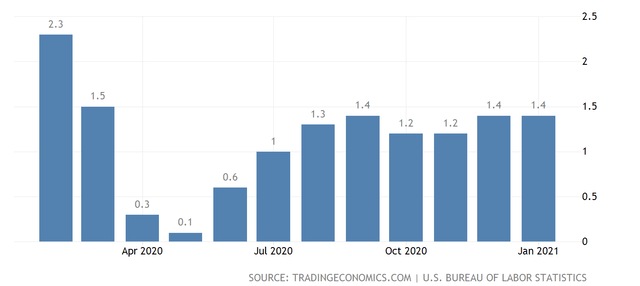
CPI Inflation 1-year
Source: Tradingeconomics.com
CPI Inflation 3-years
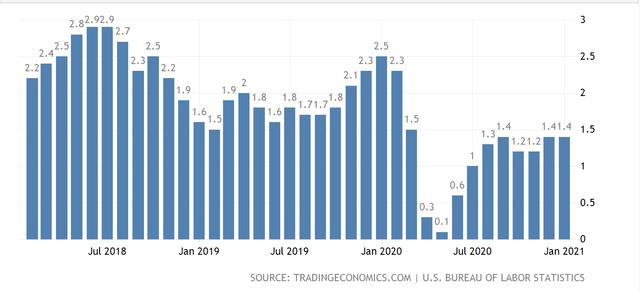
With respect to inflation, we don't see gold prices heading higher with higher inflation yet. In fact, the charts for inflation seem to mimic rates more than anything. In fact, it makes sense that inflation and key rates are closely correlated. Higher yields are often a product of rising inflation, and lower yields are typically necessary to sustain economic growth in a low inflationary environment. The key element pertaining to gold prices is whether investors can receive a positive return on their Treasuries when adjusted for inflation.
Fed Policy
U.S. monetary base long-term chart
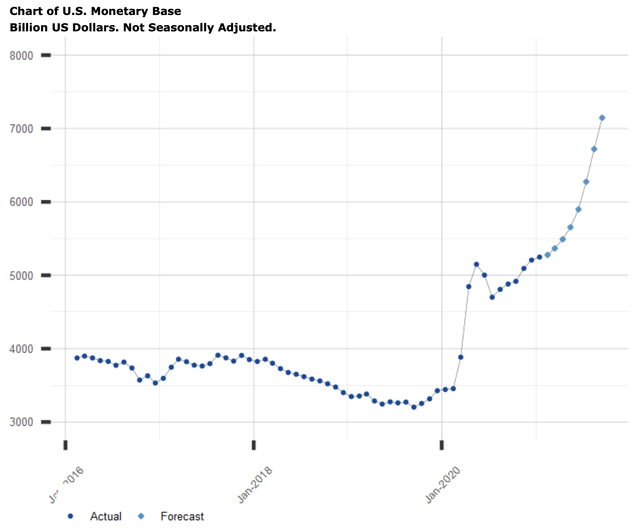
The Fed is continuously diluting the monetary base, especially since the world was decoupled from the gold standard in the early 1970s. In fact, the U.S.'s monetary base has ballooned from just around $80 billion in the early 70s to roughly $5.3 trillion as of recently. Also, we see that much of the inflating occurred following the 2008 financial crisis, as well as during the recent coronavirus pandemic. Overall, the monetary base has expanded by roughly 6,300% since the early 1970s.
Gold long-term chart
Interestingly, gold's long-term chart looks remarkably similar to the U.S.'s perpetually increasing monetary base. Likewise, we can see the "bumps" around the time of the Fed's QE programs. Also, gold had appreciated by nearly 6,000% from its price of around $35 in the early 1970s to its ATH of nearly $2,100 in 2020.
The Takeaway
The dollar index illustrates the dollar's value vs a basket of major currencies. As other major central banks are involved in QE, fiat currencies are being devalued in tandem. We see some shorter-term correlation relative to gold prices and the dollar index, but intermediate and longer-term correlation has not been that prominent in recent years. This is likely due to substantial monetary easing over the last decade or so. However, if the dollar index were to strengthen sharply it could put a dent in gold demand as it would essentially make the yellow metal more expensive in alternative currencies.
Key rates and inflation have a close correlation. However, when assessing the impact on gold prices we want to see if widely held treasuries yield a real return. Right now the 10-year Treasury is around 1.37% and CPI inflation is around 1.4%. Moreover, the 5-year is yielding just around 0.6%, and the shorter-term treasuries are yielding close to nothing, negative when adjusted for inflation. Furthermore, it is not likely that the economy is going to withstand higher rates going further, thus the upside in Treasuries is probably quite limited.
On the other hand, as the Fed continues to press forward with its easy monetary stance inflation is likely to rise going forward. Therefore, we can start to see some disconnect going forward as inflation starts to pull ahead of key yields. This is going to be quite bullish for gold, as Treasuries and other "safe bonds" (gold's competing assets) will be bringing in negative yields when adjusted for inflation.
Furthermore, the U.S.'s monetary base is projected to continue to rise from here. Right now we're at around $5.3 trillion but are likely to be at around $8 trillion by the end of this year.
In fact, we see that gold's price has an extremely close long-term correlation with the U.S.'s monetary base expansion. The monetary base has expanded by around 6,300% since the time of the gold standard decoupling, and gold had appreciated by around 6,000% (from peak to trough) since then.
Now, when we consider that the monetary base is likely to surge to around $8 trillion by year-end, we can conclude that this will give us around a 10,000% increase from the roughly $80 billion in monetary base the U.S. had in the early 1970s. Likewise, we can apply a similar percentage to the $35 gold price around the same period. A 10,000% increase from the $35 gold price would put gold prices at around $3,500 per ounce, roughly 100% higher than where the price of gold is today.
The $3,500 price tag may not be realized by the end of this year, but I think it is quite likely that we will see gold prices appreciate to this level by the end of 2022. So, in 1-2 years, it is likely that gold will be in the $2,500-3,500 range in my view.
The Problem with Gold Miners
The problem with gold miners is that many analysts appear to be factoring in stagnant gold prices for future earnings. In fact, we can see this in the futures market as well, as various futures contracts going out several years are factoring in only slightly higher gold prices. Naturally, I don't agree with this assessment, and this is why quality gold miners are likely to appreciate substantially going forward.
If gold appreciates by around 100% over the next 1-2 years, I expect many gold miners to surge by roughly 200-300%.
Some of our favorite gold mining names include:
Newmont Mining (NEM)
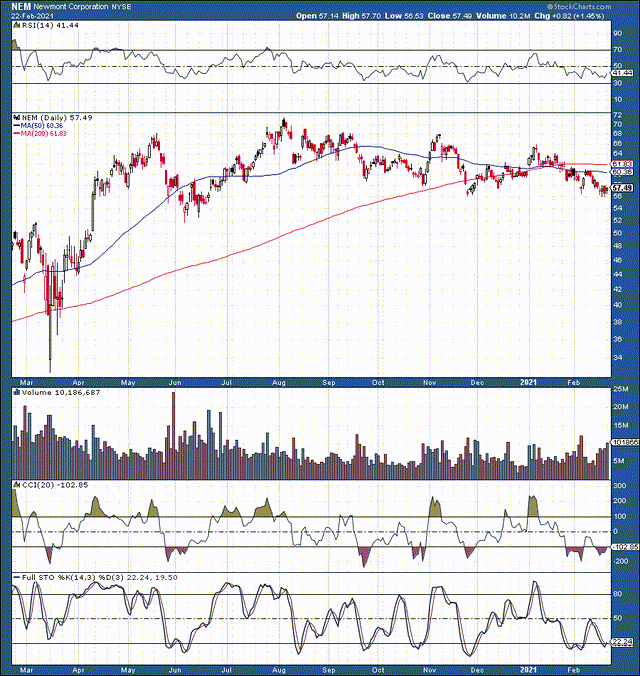
NEM is trading at around 14 times forward EPS estimates is projected to grow revenues by roughly 20% this year and pays out a dividend of nearly 4%.
Barrick Gold (GOLD)
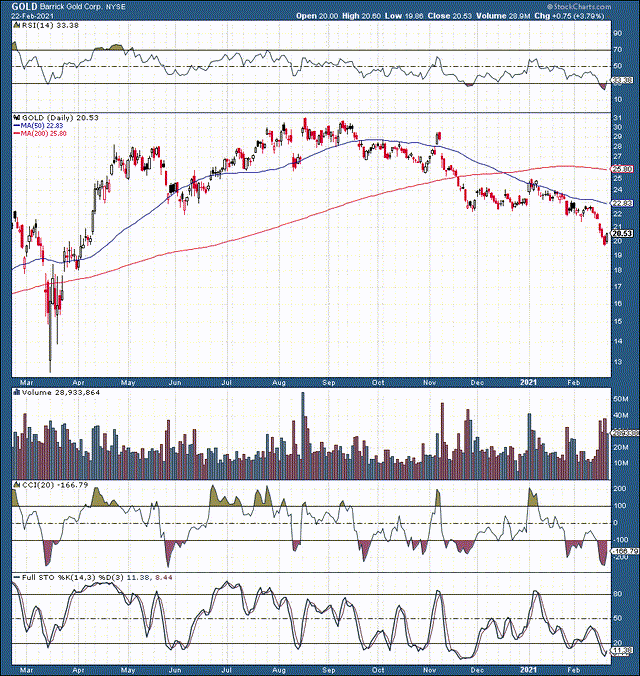
Barrick trades at about 15 times forward EPS estimates, is expected to grow revenues by around 6.5% this year and pays out a dividend of about 2%.
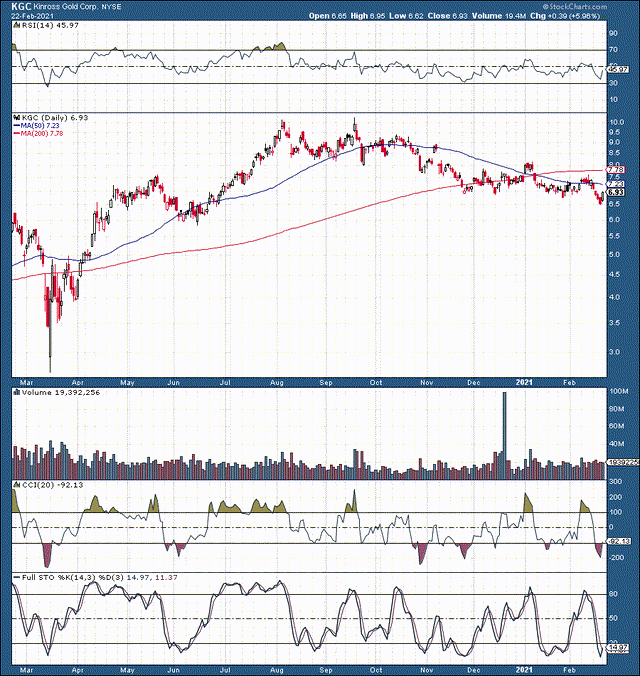
Kinross Gold (KGC)
Kinross is extremely cheap, trades at a forward P/E of only about 6, is projected to grow revenues by about 10%, and pays out a dividend of nearly 2%.
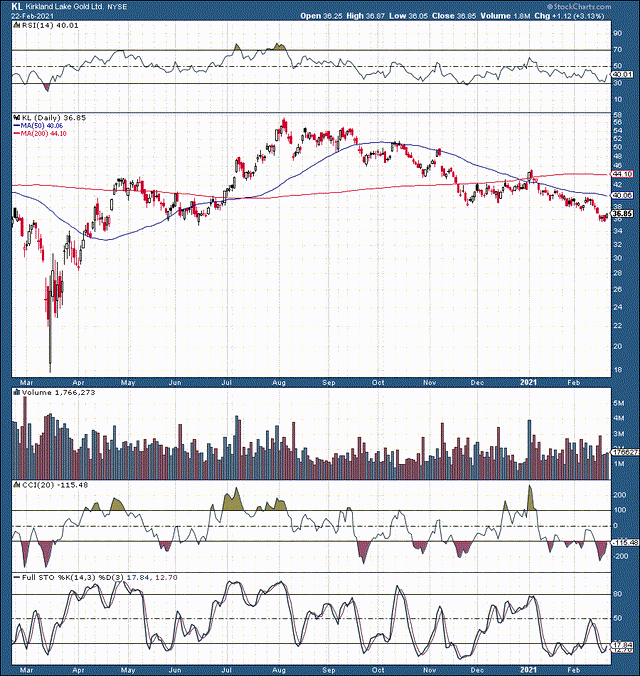
Kirkland Lake Gold (KL)
Kirkland trades at about 13 times forward P/E estimates, is expected to grow revenues at around 40% next year, and provides a dividend of over 2%.
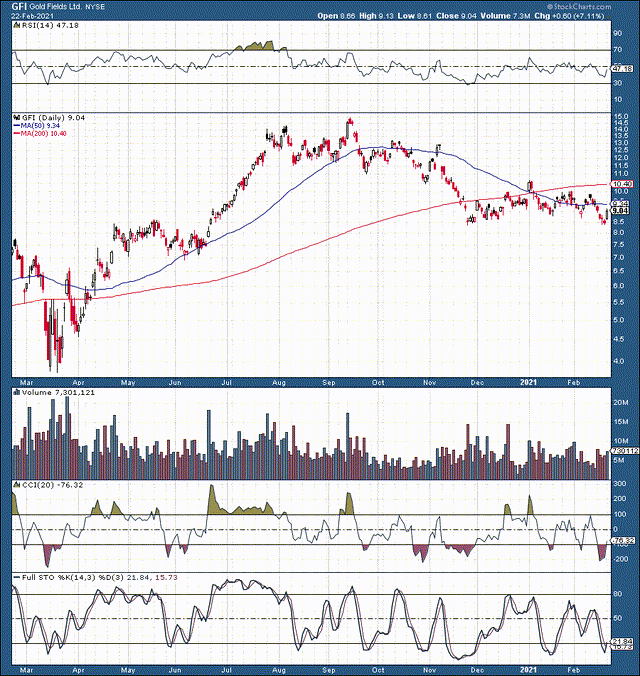
Gold Fields (GFI)
Gold Fields trades at a P/E of about 10, is expected to grow revenues by around 30% this year, and pays out a dividend of over 5%.
These are just a few of our favorite names in the gold mining sector. Where else are you going to find a company trading at 6 times earnings ready to deliver 10% revenue growth? How about a company trading at 10 times earnings about to bring in 30% YoY revenue growth along with a 5% dividend? Some of these names are trading at rock bottom valuations, and with the likelihood for higher gold prices, I expect these names can appreciate considerably over the next 1-2 years.
Price Targets (1-2 years)
- Newmont: $105-150
- Barrick Gold: $50-75
- Kinross Gold: $12-25
- Kirkland Lake: $75-130
- Gold Fields: $25-35
Want the big picture? If you would like full articles, daily market updates, comprehensive technical analysis, trade triggers, portfolio strategies, options insight, and much more, consider joining Albright Investment Group!
- Subscribe now and obtain the best of both worlds, deep value insight along top-performing growth strategies.
- Receive access to our top-performing real-time portfolio which returned roughly 87% in 2020.
- Click here for a free 2-week trial and start beating the market today!
Disclaimer: This article expresses solely my opinions, is produced for informational purposes only, and is not a recommendation to buy or sell any securities. Investing comes with risk to loss ...
more
