
Gold Market Update - Monday, March 2
Gold suffered an extraordinarily brutal smackdown on Friday afternoon, which had been presaged by a similarly violent drop in Precious Metals shares on Thursday. Right up until this development gold had been doing well and looking like it was functioning as a safe haven, in marked contrast to what happened in 2008. However, as we will see, notwithstanding this violent reversal doubtless being the product of chicanery on the paper market, it does not bode well and is a sign that as the nascent major bear market in world stock markets unfolds, investors will be running the same old script and faced by liquidity problems and margin calls, will “throw out the baby with the bathwater”, dumping everything over the side again as in past crises, and we have already seen evidence of this last week with their mindless flight into intrinsically worthless Treasuries.
Was the last update wrong? – yes, it was. Could we have seen this smackdown coming? – yes, we could – the keys to it were in the COTs, as we will shortly see. Then why didn’t we? Part of the reason was that with QE already running full bore and set to intensify, inflationary pressures are mounting that ought to make gold the “go-to” safe haven, but in a full-blown panic scenario such as we have seen over the past week, these considerations are ploughed under by indiscriminate mass liquidation by investors, and with respect to the COTs, readings had been running at a very high level for a long time, and that didn’t stop gold until last week. But in fairness to myself, I did see the crash coming and we made an absolute fortune out of Tech sector Puts, but mistakenly thought that gold and silver would weather it.
We’ll now review this major development on the charts in an effort to determine what it portends.
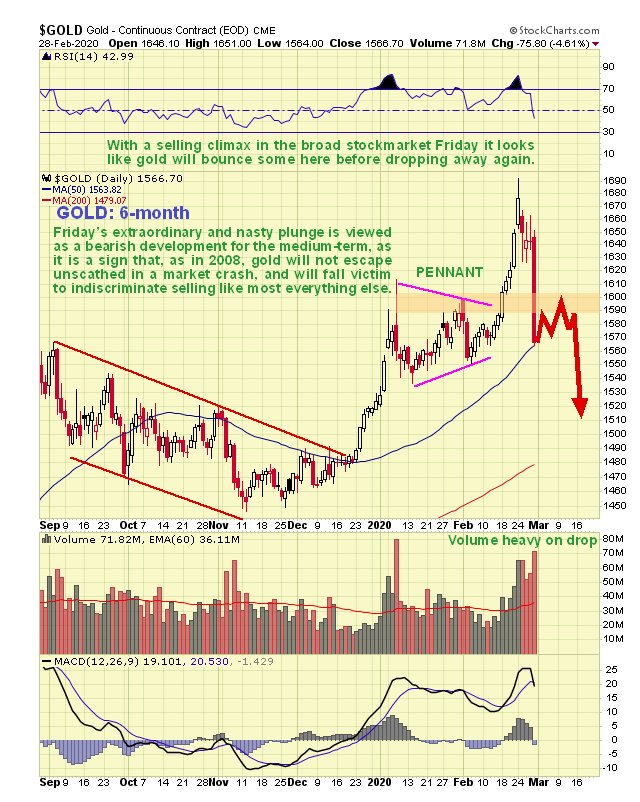
On the 6-month chart for gold, we can see that it looked fine until as recently as yesterday morning, and then all of a sudden it cratered, dropping a massive $75.80. Prior to this sudden plunge it was overbought and had looked like it would consolidate to unwind this condition, but eventually, the acute pain being felt elsewhere translated into an avalanche of selling that caused it to tank, and there was some indication of trouble brewing in the volume pattern, as the plunge was preceded by several days of heavy downside volume. The plunge yesterday broke it below both its 34 and 50-day exponential moving averages, mentioned as important in a generally bullish article by Bob Hoye in a February 24th update entitled Gold – A Review of Fibonacci Targets. This kind of massive smackdown, which took the gold price straight down to its rising 50-day moving average, is viewed as a clear “shot across the bows” and is interpreted as meaning Big Trouble. It is believed to be a sign that gold’s nascent bull market is aborting. Probably, without the coronavirus, it wouldn’t be, at least not till later, but we have to live with what we are dealt. So it is regarded as a sign that, at least during the earlier panic phase of the general bear market, gold and the PM sector generally are going to be dragged down too. Note, however, that with a reversal candle appearing on broad stock market charts on Friday, and gold arriving at its rising 50-day moving average in a short-term oversold state, it is likely to make some sort of limited recovery rally, before it turns and drops anew, as shown on the chart, which is a scenario that is considered fairly likely.
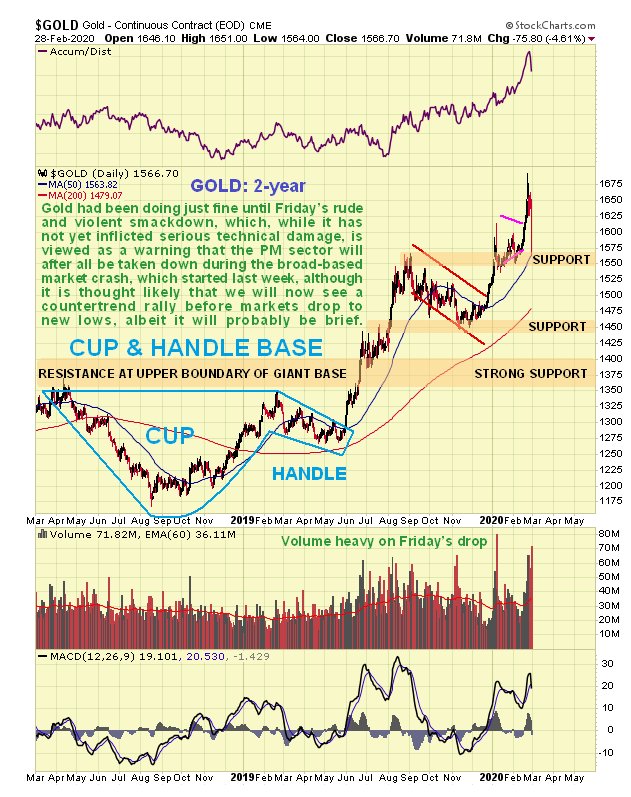
The picture presented by gold’s 2-year chart looks decidedly bullish right up to Friday’s drop, which was completely out of character with all that had preceded it, which is why it is regarded as a reversal signal. With gold having plunged in one day back to what is clearly a zone of significant support, it is an order to expect some sort of spluttering recovery short-term, or consolidation before its decline resumes.
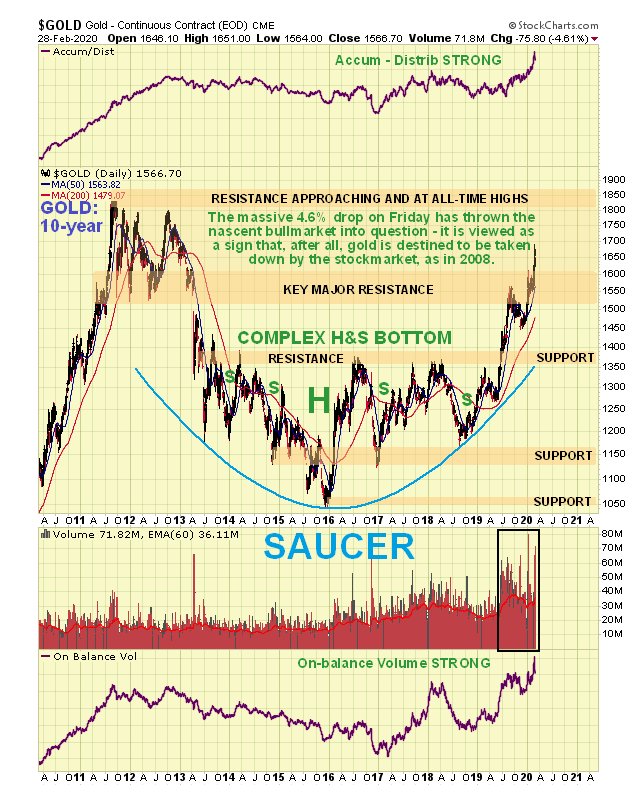
On the latest 10-year chart we can see that things were really looking up for gold (literally). So it is sad for bulls to see it falter and crumple just as it was starting to get within sniffing distance of its 2011 highs. Things could start to get really nasty for gold over an intermediate timeframe if it should drop below the Saucer boundary (produced) and then below the support at the upper boundary of the giant base pattern shown.
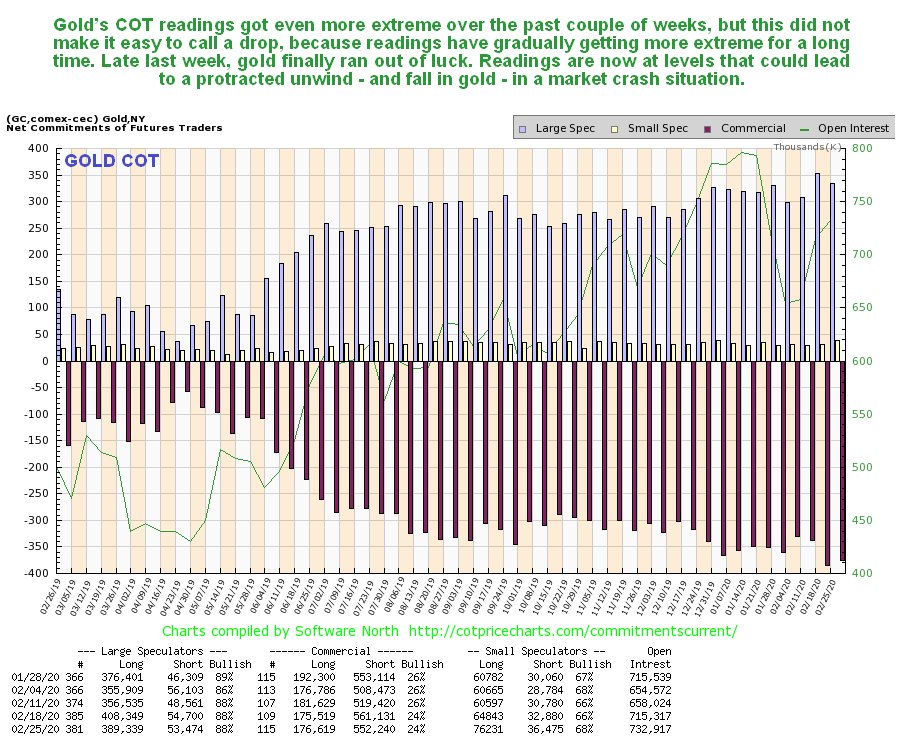
Now we come to what gave the game away that gold was riding for a fall, which is its COT structure. Commercial short and Large Spec long positions had been pushing extremes for a long time, and eventually rose to record readings, and yet gold’s price continued to rise. This bred complacency, especially in anyone who bought the argument that more and more QE would lead inevitably to a ramp-up of inflation – and we hadn’t sufficiently factored in the impact of the coronavirus and the market implosion it eventually led to. We will have to see what next week’s readings look like, but normally extremes of this magnitude take a lot of unwinding, which means that gold may have a lot further to fall.
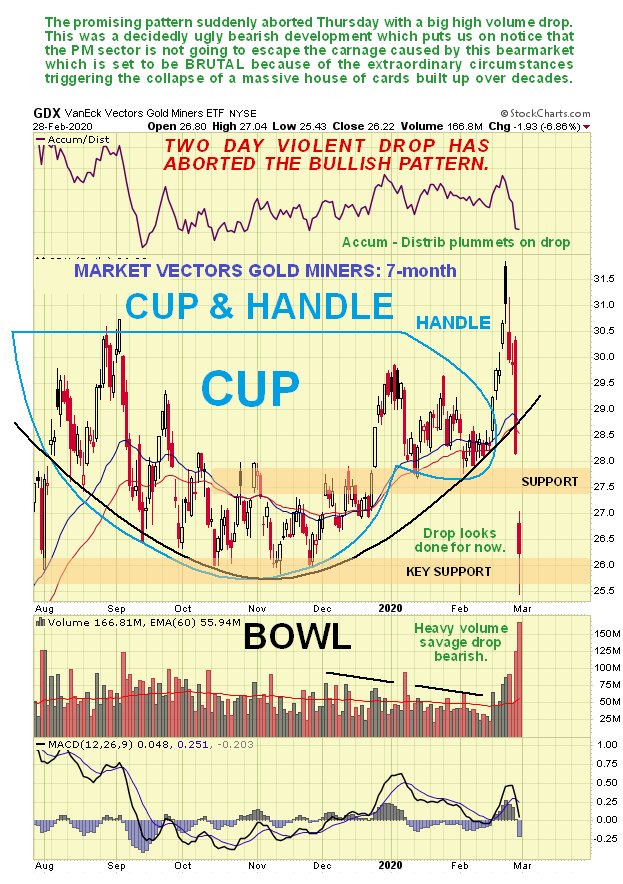
By Friday morning we had already picked up on the fact that the wheel was coming off, after spotting that the impressive GDX Cup & Handle continuation pattern breakout had violently and decisively aborted by Thursday night’s close, presaging gold’s dramatic plunge, and a warning article PM SECTOR RALLY ABORTS was posted on the site before Friday’s open. This is viewed as a very bearish development for the sector, especially as GDX followed through with another big down day involving a gap down through support and very heavy volume. Currently, it has come to rest at the strong support at the bottom of the Cup, which is likely to produce a modest recovery rally, especially if the broad market rallies next week as expected, but after that it is expected to turn down again and crash this support level.
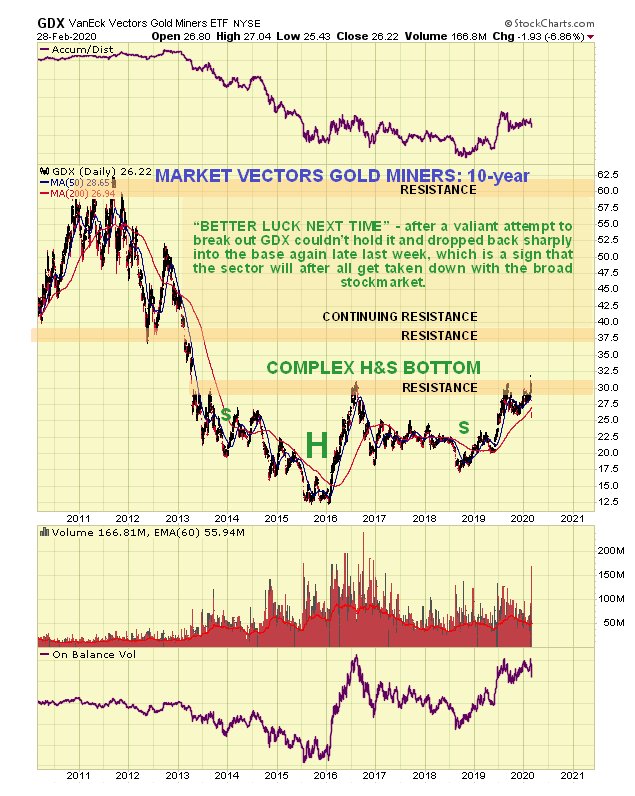
On the 10-year chart we can see that GDX, after long preparation, is “all dressed up and nowhere to go” – the show has been called off it would seem, at least for the foreseeable future…
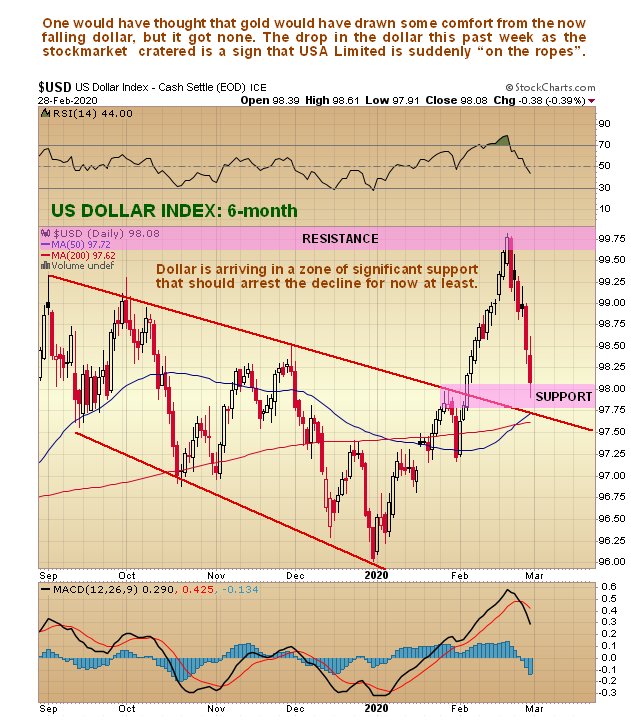
You might think that with gold plunging the dollar might be rallying, but it fell all last week, along with the stock market, which is a disturbing sign that America Inc. is heading for the rocks. So the falling dollar provided no upward impetus for gold at all last week. The 6-month chart for the dollar index shows it arriving at significant support at its bunched and rising moving averages and the upper boundary of an earlier downtrend channel, so it may turn up shortly, at least for a while. With respect to the outlook for the dollar, your attention is drawn to a very interesting if the worrisome article in gold money cheerfully entitled Why a bear market will lead to a dollar collapse.
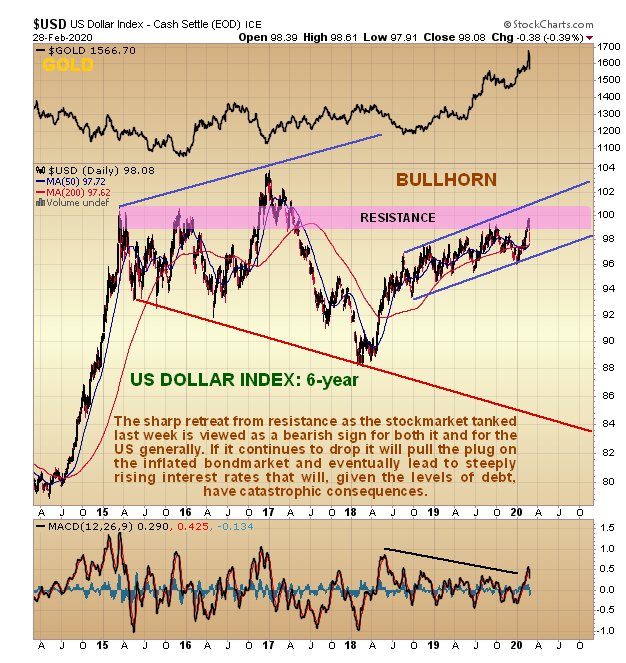
For a long, long time we have been tracking a large ugly pattern forming on the long-term charts for the dollar index. On the 6-year chart, we can see that a giant irregular “bullhorn” pattern has been building out since early 2015. These patterns are normally tops, although often they end with a rally to new highs before they break down, which is why we have been rather undecided about the dollar’s long-term movements for quite a while.
So, to sum up, even though a near-term recovery rally is on the cards for gold and the PM sector, the action late last week is interpreted as bearish and a sign that the recent bull run is aborting and that gold will get dragged down by the gathering global bear market, at least during its early panic phase, as it becomes a victim of indiscriminate selling in the face of margin calls, etc. and a dash to cash. After that, as an attempt is made to resuscitate the wrecked global economy by printing blizzards of money like the Weimar Republic, gold should recover to unimaginable heights.


