
Gold: Making The Winter Lows Before The Spring Stimulus Rally
Fundamentals
Gold and silver on Friday posted moderate losses on the strengthened dollar. Silver was also hurt after Germany reduced its GDP estimate for this year, which reduces expected industrial metals demand, such as silver. Germany cut its GDP forecast to 3% from 4.4%. Germany said the extended lockdown was the cause and a member of the ECB Governing Council said the "balance of risks was still on the negative side but there are signs that could turn the balance of risks to neutral." Gold did not lose much, as stocks fell, which made gold a safe haven for jittery investors. US economic data was better than expected, so silver also recovered some. Friday's US economic data was bearish for gold, but bullish for industrial metals and silver prices. The US January market to manufacturing PMI rose unexpectedly 2.02%, stronger than negative expectations and the fastest expansion since the data started being collected. Home sales also unexpectedly rose 0.7% to 6.76 million. Slacker consumer price pressures in Japan are negative for gold as a hedge against inflation. The Japan national CPI fell -4% year to year, the fastest fall in seven and a half years.
Gold is supported by the ongoing pandemic, which is dovish for central bank policies. Lockdowns, however, are negative for economic growth and industrial demand, which hurts industrial metals, such as silver. Thursday, President Biden warned that the pandemic would worsen before it got better and another 100,000 US COVID deaths are expected over the next month.
Safe-haven demand and dovish central bank policies have led to buying of precious metals in recent months. Long silver positions and ETFs rose to a record Thursday of 912,058 troy ounces. However, long gold positions are being liquidated, as long positions fell to 5¾ month low on December 22.
For gold and silver, bullish factors include highly stimulative monetary policies pursued by the world's central banks, the recent sell-off in the dollar index to a 2¾ year low, low global inflation, fund and retail buying of precious metals near or at record highs; and safe-haven demand due to the pandemic and geopolitical risks from Iran, North Korea and Venezuela. Bearish factors include bearish fears of deflation due to the long-term economic damage of the pandemic, sharply reduced industrial metal demand for silver due to the economic downturn, the recent increase in Treasury note yields to a 10-month high, which pushes investors out of non-interest bearing metals, COVID-19 vaccines may lead to a rapid economic recovery, and record high stock prices which reduces safe-haven demand for precious metals.
Gold
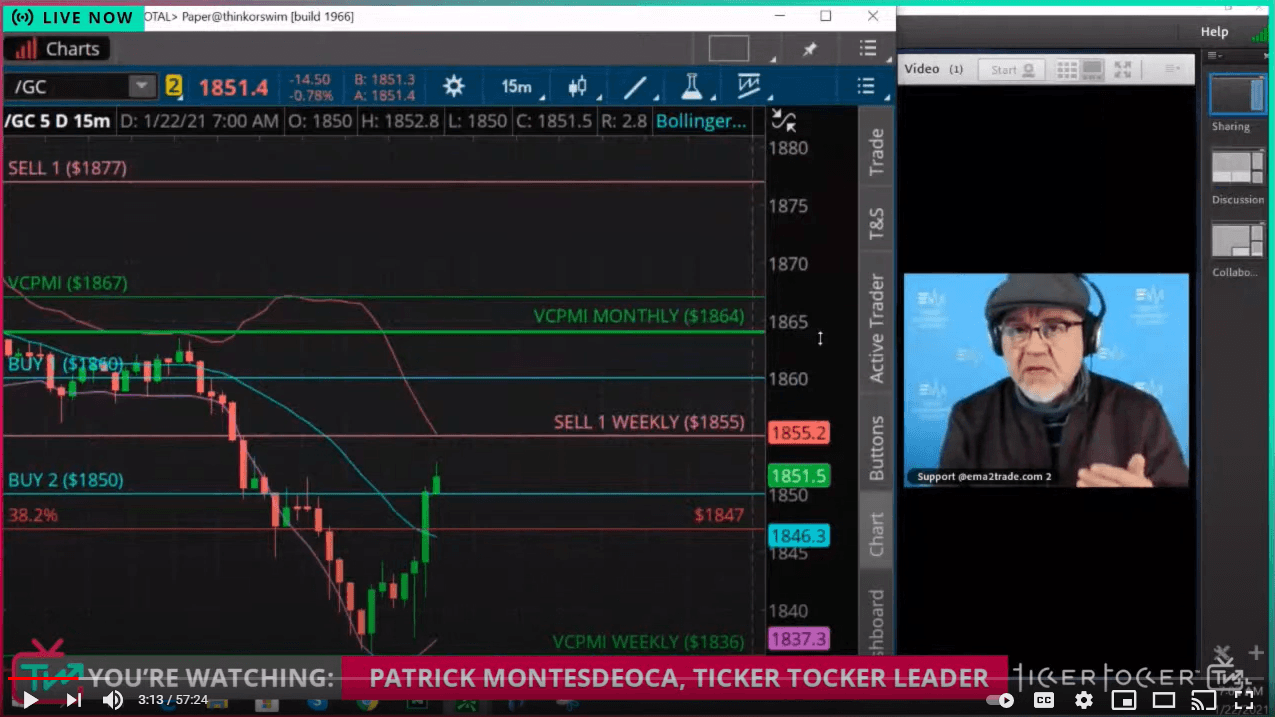
Courtesy: Ticker Tocker
For this coming week, based on the Variable Changing Price Momentum Indicator (VC PMI), gold closed at $1855.50, down about $10.40. After coming down to test the $1800 low, the market reverted right back up to test the high end of this pattern around $1874. This correction from the high of $1962.50 confirmed that the weekly and monthly VC PMI targets were completed. After reverting from this high, the market came down from Jan. 6 to Jan. 19 to a low of $1800. That's about a $162 correction. The recent highs around $1966 appear to be the ceiling of resistance.
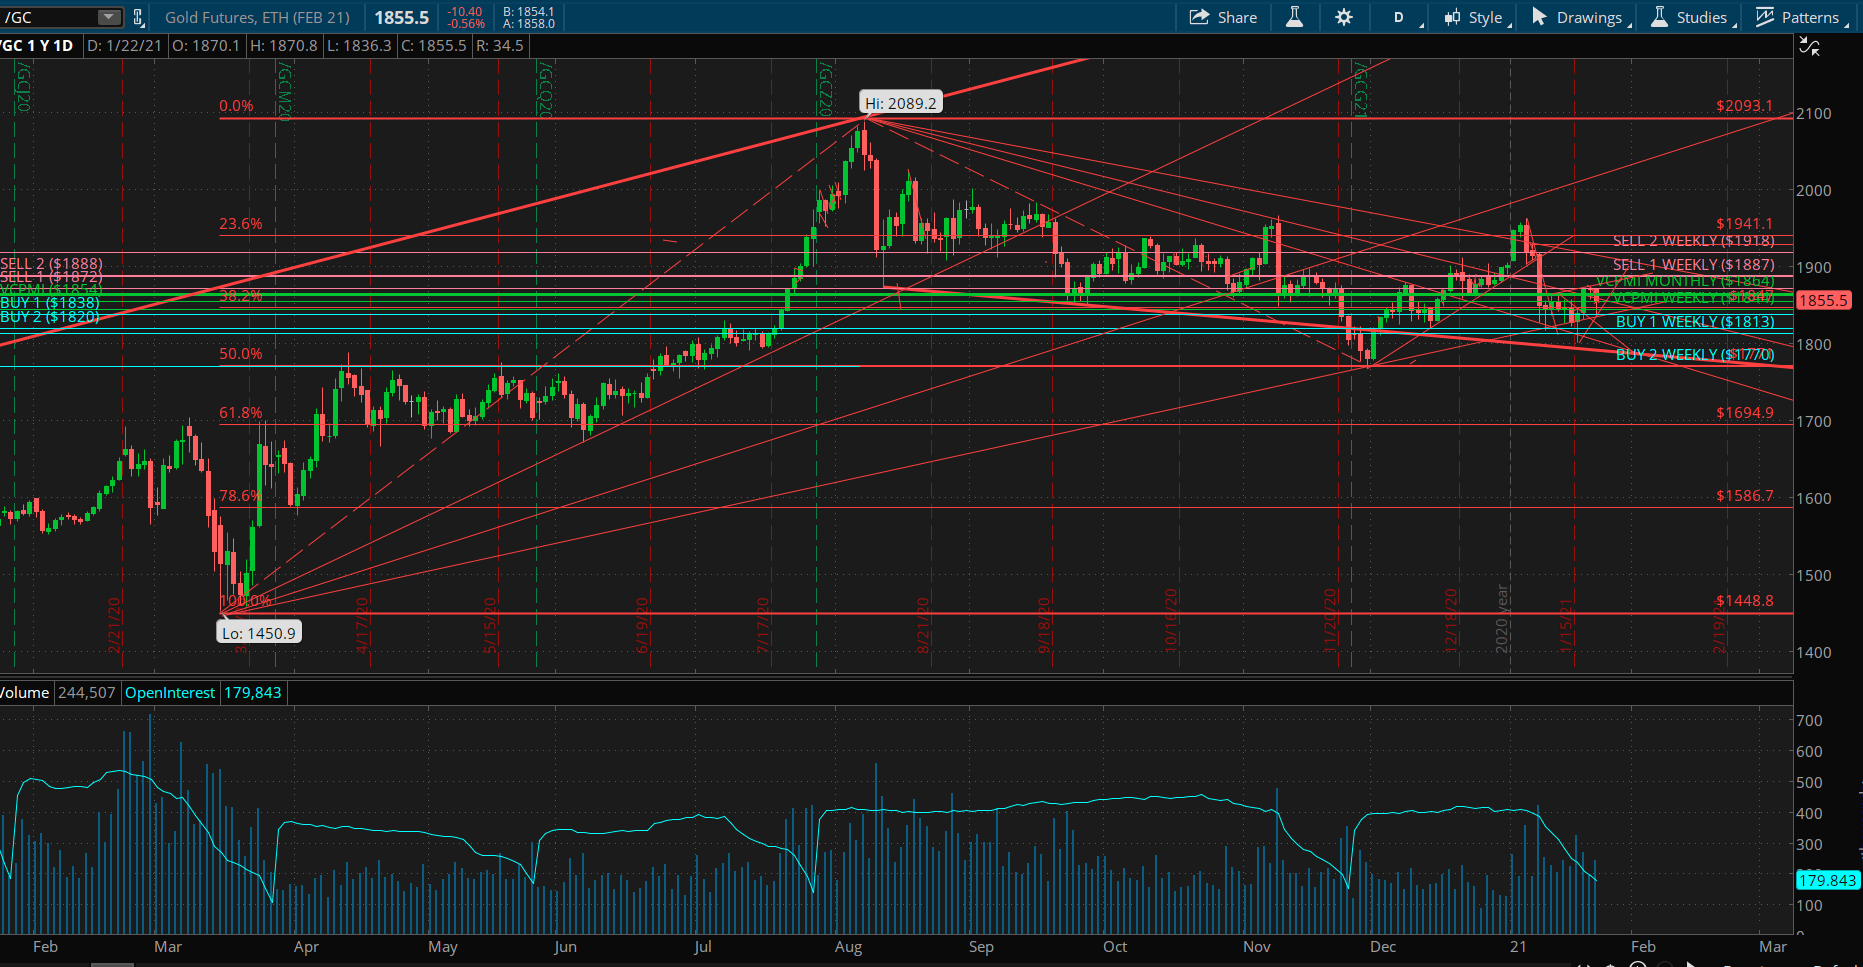
The high on Aug. 7 at $2089 completed the previous pattern that began in March 2020 around the $1450 low. This was the start of the pandemic and no one knew the damage that would be expected. Gold rallied to $2089 on the basis of the Fed coming into the market to provide as much stimulus as necessary. According to some recent comments by the Fed governor back in March the Fed and the Treasury had discounted about 10% of GDP to be allocated to supporting the markets. That means about $24 trillion was planned for stimulus for the economy. The gold market appears to have discounted the potential damage, and reverted back to the mean.
Last year's low was $1767, which was close to the 50% Fibonacci retracement that we had in place from the low in March to the recent high of $2089. It established the annual 2020 low for the VC PMI. The VC PMI said that low would be tested, which the market did and then reverted right back up. It activated an annual bullish trend momentum according to the VC PMI. That bullish trend momentum set targets of $2164 to $2242.
For the VC PMI monthly, the Buy 1 level of $1816 is very close to the $1810 level. That is a harmonic alignment, which provides a high probability that if gold comes down to that area, a reversion is likely to unfold with the targets above activated. The short, intermediate, long and cyclical trends appear to be in harmony. $1675 is the average for the nine-year cycle.
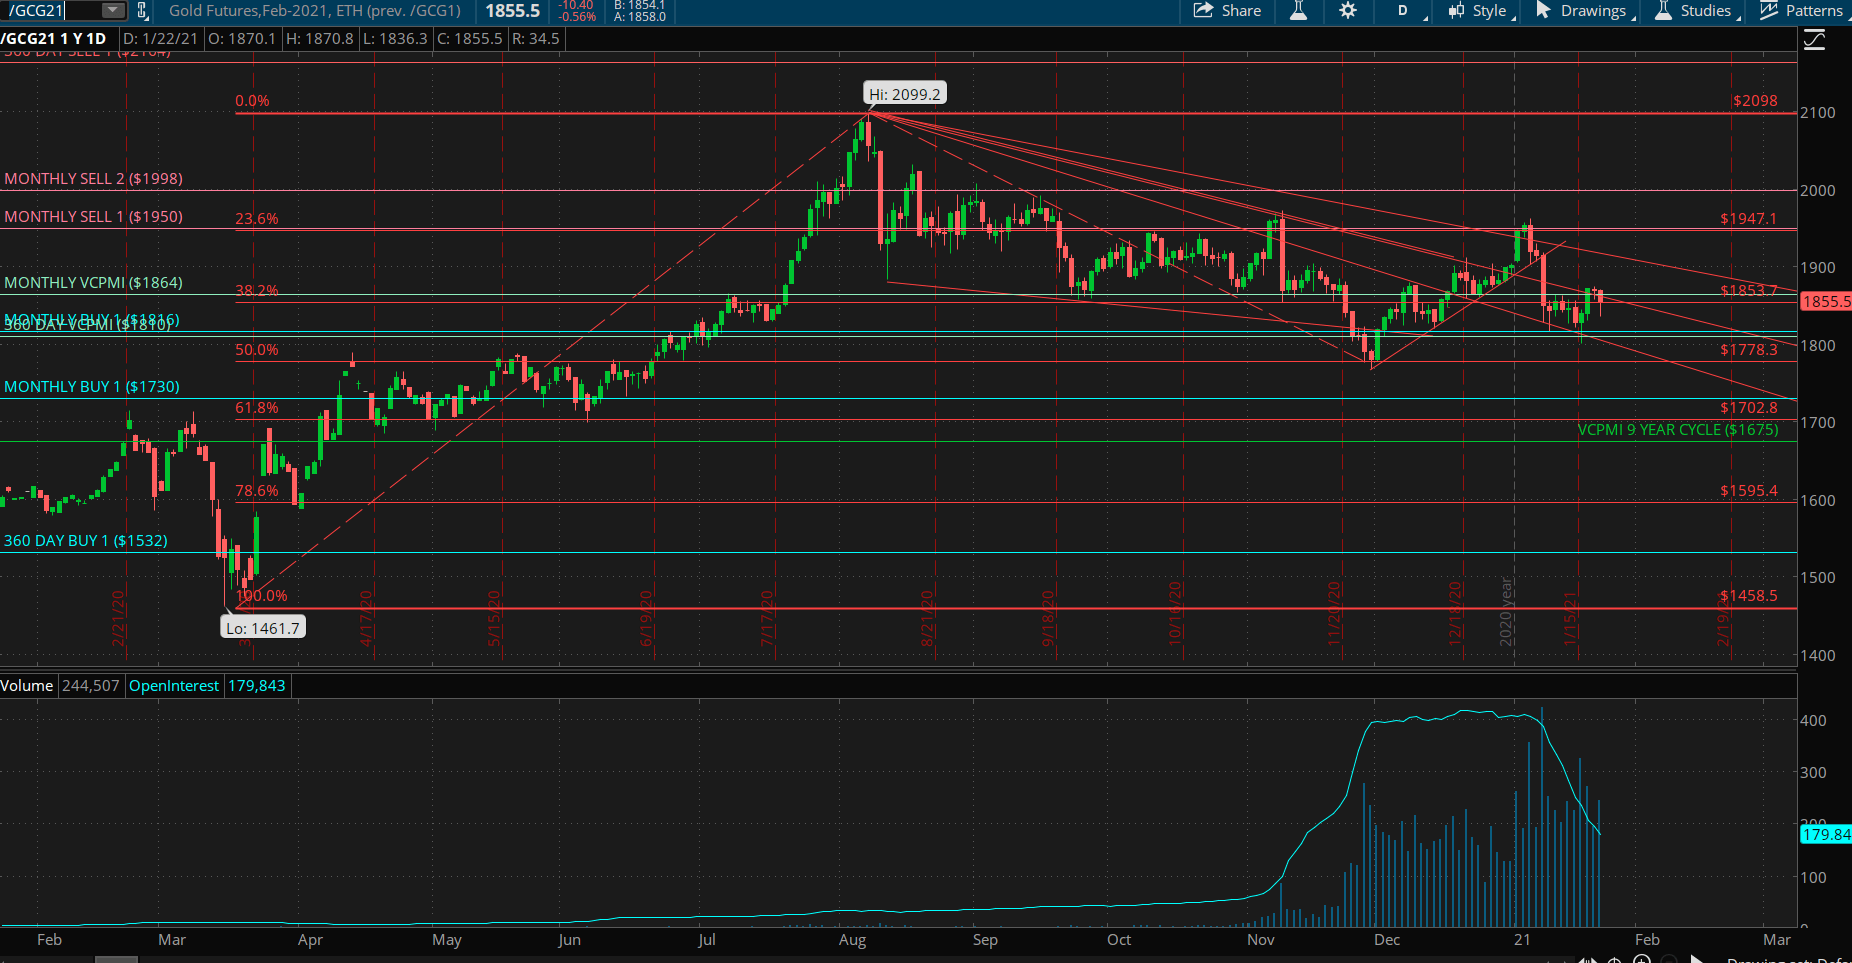
As we come into this week, the monthly average is $1864. Gold closing below that level means that we have a bearish monthly trend momentum, which activates the $1816 to $1810 price levels, unless it's negated. If it closes above $1864, it will negate this bearish pattern to neutral. A close above it would activate the targets above of $1950 as the monthly Sell 1 target. We appear to be testing the lower end of the monthly and 365 day averages.
The Fibonacci fans help us identify and confirm the momentum of the market and its extremes. The monthly trend momentum is bearish and the annual bullish trend momentum has a target of $2164. A close above $1864 will negate this monthly bearishness and activate a bullish momentum with targets of $1950 to $1998.
For the shorter-term VC PMI signals, we can see that the market closing above the daily average of $1854 is bullish, activating the monthly target of $1864. The daily targets are $1872 to $1888. A close above $1864 on the monthly will activate the higher numbers, but in between is the weekly VC PMI Sell targets of $1887 to $1918. We recommend using these pivot points to lock in your trading ranges regardless of the fundamentals of the market.
Strategy
As we come into next week, the fundamentals are bullish for gold. The market does not appear to be reacting to the fundamentals. It appears to be looking for additional support to go up to the annual targets. We would like to see the price at $1864 or higher and complete the $1872 to $1888 targets, which would show a harmonic alignment. If you are long, this might be an area to manage your profits. You could Delta neutralize your position or synthetically cover your position.
If the market comes down below the weekly $1844 - $1854 would be the daily - it would increase the probability that the market will test the lower end of this support level. $1838 to $1820 are the lower levels, with the weekly Buy 1 of $1813 to $1770 as the Buy 2 weekly level. $1820 to $1813 offer the harmonic relationship we are looking for to get on the long side of the market.
The market is coming into this week with a bullish weekly and daily trend momentum. A close above the monthly average of $1864 will put the targets of $1872 to $1888 into play, at which point we recommend locking in profits. Then let the market show you where it wants to go. Above $1888, we have the second target level of $1918, but we begin to see a large area of distribution of supply, which would be attractive for sellers to come in and offer supply, if activated.
Disclosure: I am/we are long GDX. I wrote this article myself, and it expresses my own opinions. I have no business relationship with any company whose stock is mentioned in this ...
more

