
Gold: Is The Uptrend Ready To Resume After A Healthy Correction?
As the third quarter winds to a close, everyone’s favorite yellow metal has been a standout performer.
After a stellar 7% rally in June, gold has tacked on another 9% so far this quarter with prices peaking at a 6.5-year high above $1550 at the start of this month. With prices pulling back from the recent highs, the biggest question for gold traders is whether this marks the end of the summer’s explosive rally or merely a healthy correction in the context of the longer-term uptrend.
From a fundamental perspective, the factors driving this summer’s big rally remain intact: global geopolitical tensions (US-China, Iran, Venezuela, North Korea, etc) remain elevated, and interest rates remain at record lows across the developed world. Subdued interest rates decrease the opportunity cost of holding gold and have historically been associated with higher prices. Looking at sentiment and positioning, futures traders remain heavily long the yellow metal, but bulls have pared back their bets in recent weeks, potentially clearing the way for another leg higher in the short term.
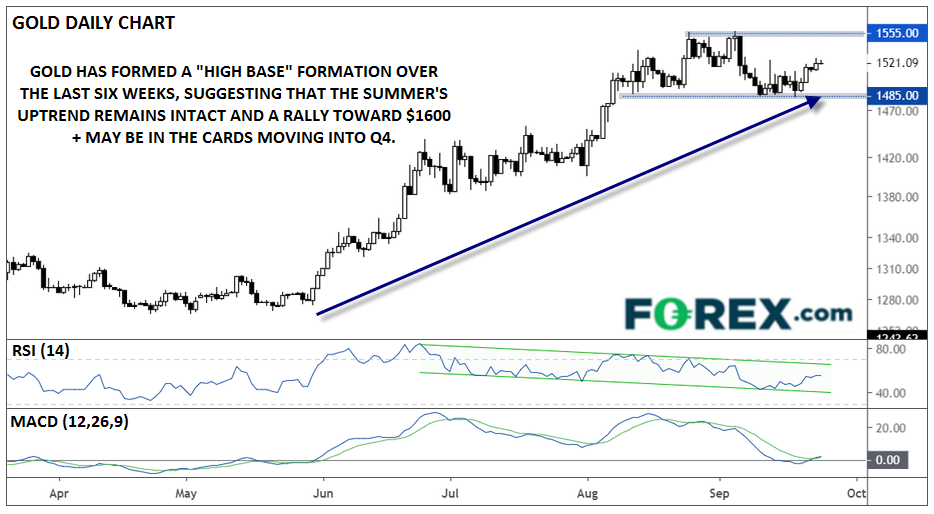
Technically speaking, gold has not yet set a meaningful “lower low,” keeping the recent uptrend intact. Instead, prices have spent the last six weeks consolidating between support at $1485 and resistance at $1555. This sideways price action, coming after a strong bullish rally, creates a “high base” formation which shows that the bullish euphoria is correcting through time rather than through price. Generally, these types of patterns result in a topside breakout and a continuation of the established uptrend.
(Click on image to enlarge)
Source: TradingView, FOREX.com
With the RSI indicator pulling back from overbought territory and the MACD turning higher to cross above both its signal line and the “0” level, the stage is set for gold to take another leg higher. Traders should watch for a confirmed breakout in price above $1555, as well as the RSI indicator breaking out of its near-term bearish channel, to signal a potential continuation toward $1600 or higher heading into Q4. That said, a bearish breakdown through near-term support at $1485 would suggest that a deeper retracement is in the cards, with bears looking to target previous-resistance-turned-support in the $1440 area.


