
Gold Forecast: Gold Volatility Surging As Real Yields Tumble
Precious metals like gold and silver have traded quite favorably over recent weeks. Gold price action, for example, has now climbed nearly 10% from its 08 March low around $1,680/oz. The strong rebound being staged by gold bulls seems to largely track the reversal lower in real yields. This has followed a sharp rise in inflation expectations, which is a trend that may persist and even outpace perkiness across nominal interest rates. Even with the ten-year Treasury yield recoiling 12-basis points higher off Friday’s swing low, gold prices have been able to extend higher. That said, the Federal Reserve just released its monthly survey of consumer expectations earlier today, which detailed another rise in short-term inflation expectations from 3.2% to 3.4%.
Gold Price Chart With Ten-Year Real Yields Overlaid: Daily Time Frame (02 June 2020 to 10 May 2021)
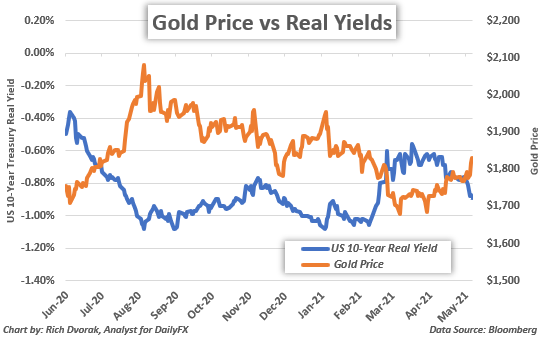
Several other gauges of inflation have shown building price pressures, too. Five-year inflation swaps have risen above 2.5% to hit their highest reading since January 2018. Prices for major commodities have been ripping higher and threaten to weigh on consumers’ pocketbooks. Business activity surveys like the ISM’s monthly PMI report have highlighted constrained supply chains and production bottlenecks that stand to seep into the economy. Even so, Fed officials have professed that rising inflation is likely to be transitory and how the central bank is willing to stomach modest inflation overshoots above the 2% average inflation target. This brings to focus high-impact inflation data due for release this coming Wednesday, 12 May at 12:30 GMT.
Gold Price Chart With GVZ Index Overlaid: Daily Time Frame (10 July 2020 to 10 May 2021)
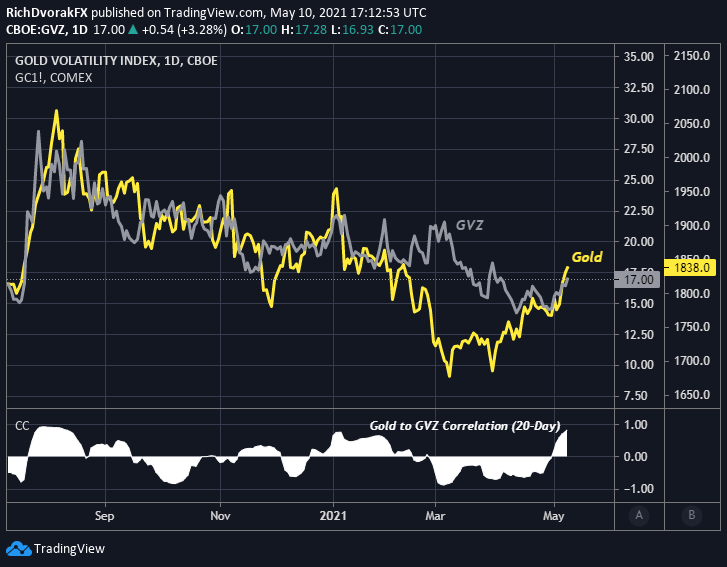
Chart by @RichDvorakFX created using TradingView
Meanwhile, taking a look at the GVZ Index suggests that gold volatility is expected to continue accelerating higher. The GVZ Index reflects 30-day implied volatility for the SDPR Gold Trust ETF (GLD). Broadly speaking, gold price action tends to move in the same direction of and hold a positive correlation with gold volatility. By extension of this generally direct relationship between gold prices and gold volatility, there could be enough bullish momentum behind the precious metal to challenge – and perhaps eclipse – its 200-day SMA. A reversal lower in expected gold volatility, however, could indicate that bulls are looking to unwind the recent rally.
Disclosure: See the full disclosure for DailyFX here.


