Gold, Crude Oil Price Outlook: Market Digests Strong NFP And Higher Yields
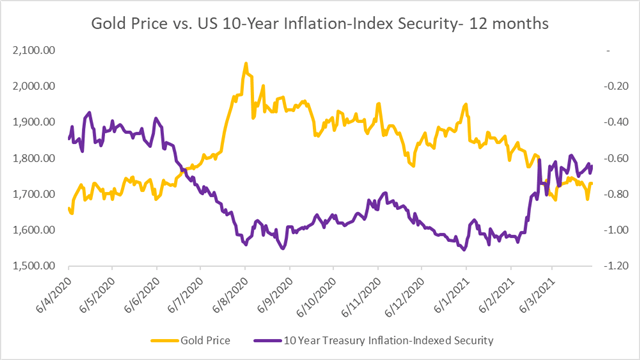
Gold prices fell modestly during Monday’s APAC morning session, pausing a three-day gain as the 10-year Treasury yield climbed more than 3%. A much stronger-than-expected US nonfarm payroll print boosted reflation optimism and led longer-dated rates higher, undermining the non-yielding precious metals. Meanwhile, the DXY US Dollar index was a little moved amid a quiet trading session as several key APAC markets are closed for public holidays. Higher price volatility may be expected when traders return on Tuesday and digest the latest jobs data.
The March nonfarm payroll figures came in at 916k, compared to a baseline forecast of 647k. This marks the strongest gain in seven months. February’s reading was revised up to 468k from 379k, showing continuous improvement in the job market as vaccine rollouts eased lockdown restrictions. A robust reading was mainly attributed to a surge in leisure and hospitality (+280k), bars and restaurants (+176k) as well as construction jobs (+110k). The rapid healing of the labor market from the second pandemic wave may reinforce reflation hopes and dampen prospects for gold prices.
Brighter jobs data, alongside President Joe Biden’s fresh $2.25 trillion infrastructure stimulus proposal, may continue to encourage investors to shift their capital into risk assets such as equities for yield and growth. Non-yielding assets such as precious metals appear lackluster against this backdrop, and exchange-traded gold ETFs have suffered continuous outflows over the past few months.
Gold Prices vs. 10-year Treasury Inflation-indexed Security
Source: Bloomberg, DailyFX
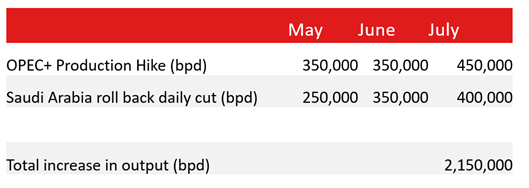
Crude oil prices retreated slightly on Monday amid a quiet trading session. Volume was much thinner than usual as HK, Australia, mainland China and most parts of Europe are closed for the Qingming Festival and Easter holiday. Last Thursday, oil prices advanced more than 3% as OPEC+ surprised the market with a total 2.25-million-barrel production hike from May to July (table below). Prior to this, market participants had widely expected a rollover of the current production cuts through May.
Nonetheless, the move showed that the oil cartel and its allies are confident about the recovery of global energy demand towards the summer, and the time is ripe to gradually unwind the production cuts introduced during the pandemic. Saudi Arabia has further raised prices for oil exports to Asia in May by between 20 and 50 cents a barrel, underscoring the region’s robust recovery and solid demand for energy products. Meanwhile, most prices for North West European customers won’t change as a third viral wave sweeps the region.
OPEC+ Plans to Increase Oil Output by Over 2 Million bpd from May to July
Source: Bloomberg, DailyFX
Gold Price Technical Analysis
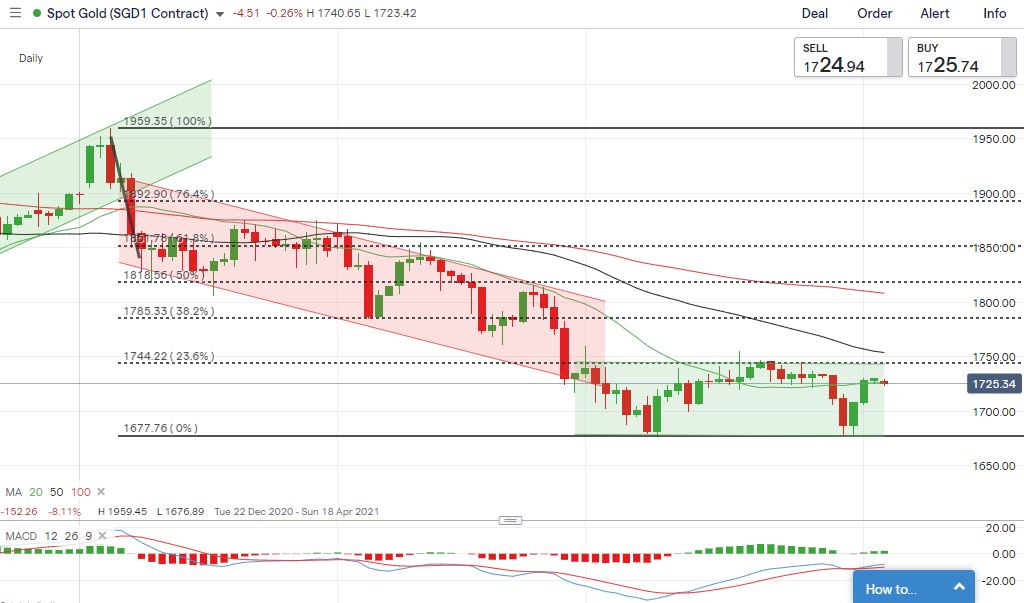
Gold prices rebounded from a key support level at US$ 1,676 and extended slightly higher. Prices may continue to be range-bound between US$ 1,676 and 1,744 in the near term, with the floor and ceiling serving as immediate resistance and support levels. The primary trend remains bearish-biased however, as suggested by the downward-sloped 50- and 100-day SMA lines, although the 20-day SMA seems to be flattening. The MACD indicator is trending higher beneath the neutral midpoint, suggesting that selling pressure is fading and momentum is tilted towards the upside.
Gold Price – Daily Chart
(Click on image to enlarge)

Crude Oil Price Technical Analysis
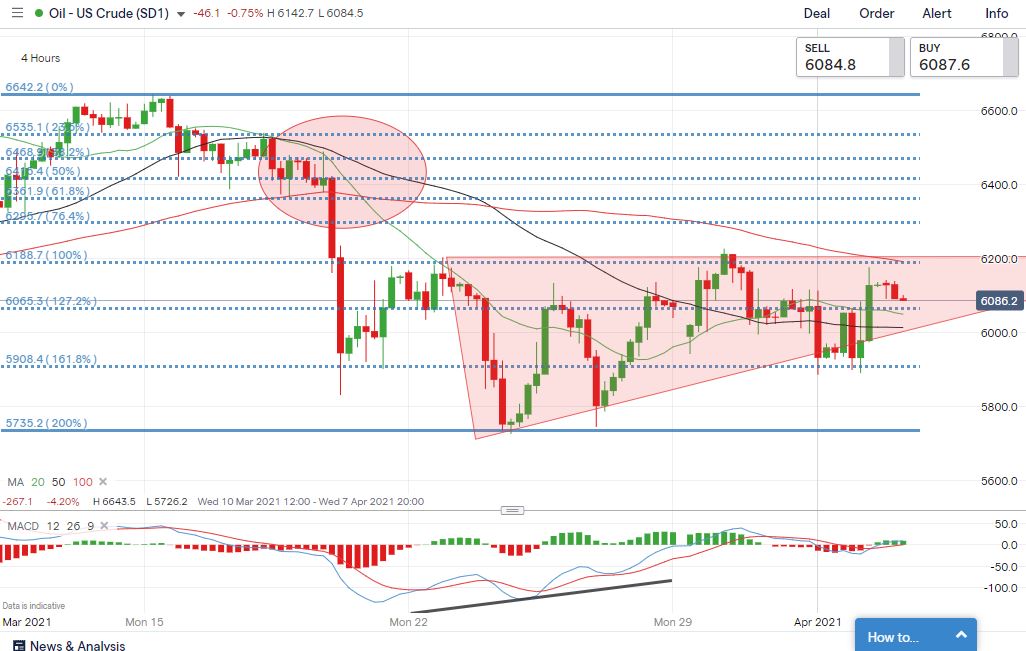
An “Ascending Triangle” appears to be forming at the bottom of oil’s downtrend, indicating that downward momentum is fading before potentially changing direction. Prices have likely found immediate support at 59.08 – the 161.8% Fibonacci extension. An immediate resistance level can be found at 61.88 – the upper trendline of the “Ascending Triangle”. The MACD indicator is trending higher, signaling that bullish momentum may be building.
Crude Oil Price – 4-Hour Chart
(Click on image to enlarge)

Disclosure: See the full disclosure for DailyFX here.


