
Gold, Crude Oil Price Forecast: Technicals In Focus As Yield Drop Propels XAU
Gold prices have been on the up this month as the yellow metal’s fundamental outlook improved, as markets capitulated further to a transitory view on inflation. XAU/USD is tracking near 3.3% higher month-to-date, following a 7.19% decline in June. That is when taper talk fears, spurred by rising prices, pushed the US Dollar and Treasury yields higher. This dynamic can decrease the attractiveness of gold as an investment.

Image Source: Pixabay
Federal Reserve Chair Jerome Powell reinforced the transitory inflation outlook again on Wednesday. Speaking to lawmakers on a House committee, Mr. Powell said inflation “has been higher than we’ve expected and a little bit more persistent.” The Fed chief’s comments reference the strong increases seen through the Personal Consumption Expenditures Price Index (PCE) and the Consumer Price Index (CPI).
Market-based measures of inflation show the same picture, although upward pressure has eased recently. The 5-year breakeven inflation rate has fallen nearly 20 basis points since reaching a post-pandemic high in May. That pullback has been a boon for gold. Moreover, consumers’ expectations for inflation have eased, with June’s University of Michigan Survey showing a drop in the 1-year expected rate from 4.6% to 4.0%. Friday will see an update to those numbers.
While further persistent inflation will likely shift the market’s view on the Federal Reserve’s timeline to pull back easy monetary policy, it is hard to say how high and for how long it would take before the Fed signals that it will potentially move to tamp down on prices. The Fed’s preferred metric, PCE, will cross the wires on July 30. Until then, it is likely that the current outlook remains the status quo. This may help gold prices run higher in the meantime.
Gold Technical Outlook
Gold is attempting to break above the key 200-day Simple Moving Average (SMA), which would likely brighten its technical posture and pave the way for more upside. The MACD oscillator is looking to cross above its center line, a bullish signal. The next area of resistance may be at the 50-day SMA or an area of prior resistance seen in May. Alternatively, a shift lower would see an area of recent support possibly underpin prices.
Gold Daily Chart
(Click on image to enlarge)
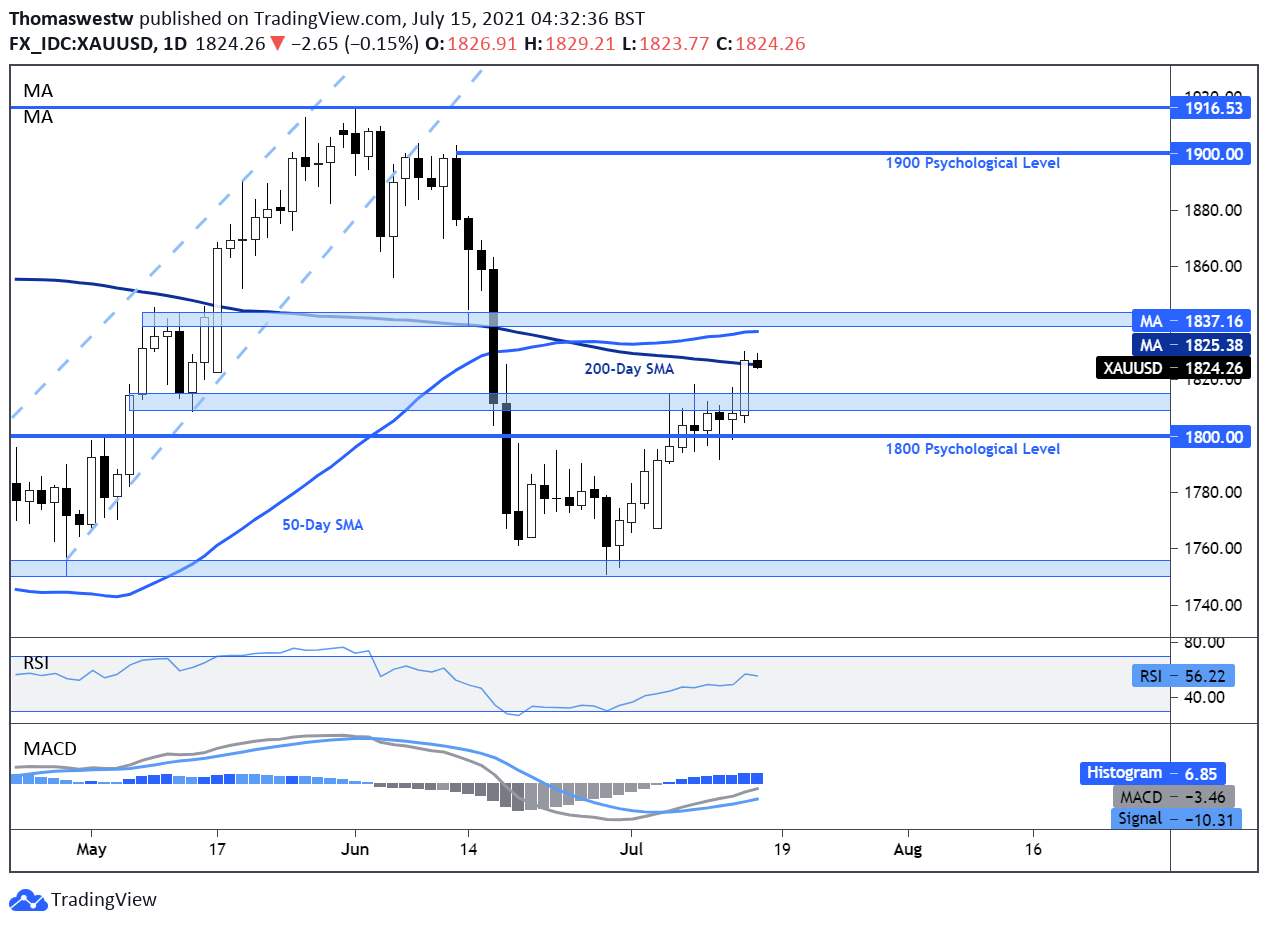
Chart created with TradingView
Crude Oil Technical Outlook
Crude oil prices are looking lower, but support from the 26-day Exponential Moving Average (EMA) appears to be providing a layer of support to prices. The 61.8% Fibonacci retracement from the June/July move is offering a confluent support point. MACD and RSI are both on the move lower, indicating downside momentum may be increasing. That said, the 70 psychological level is a possible target for bears.
Crude Oil Daily Chart
(Click on image to enlarge)
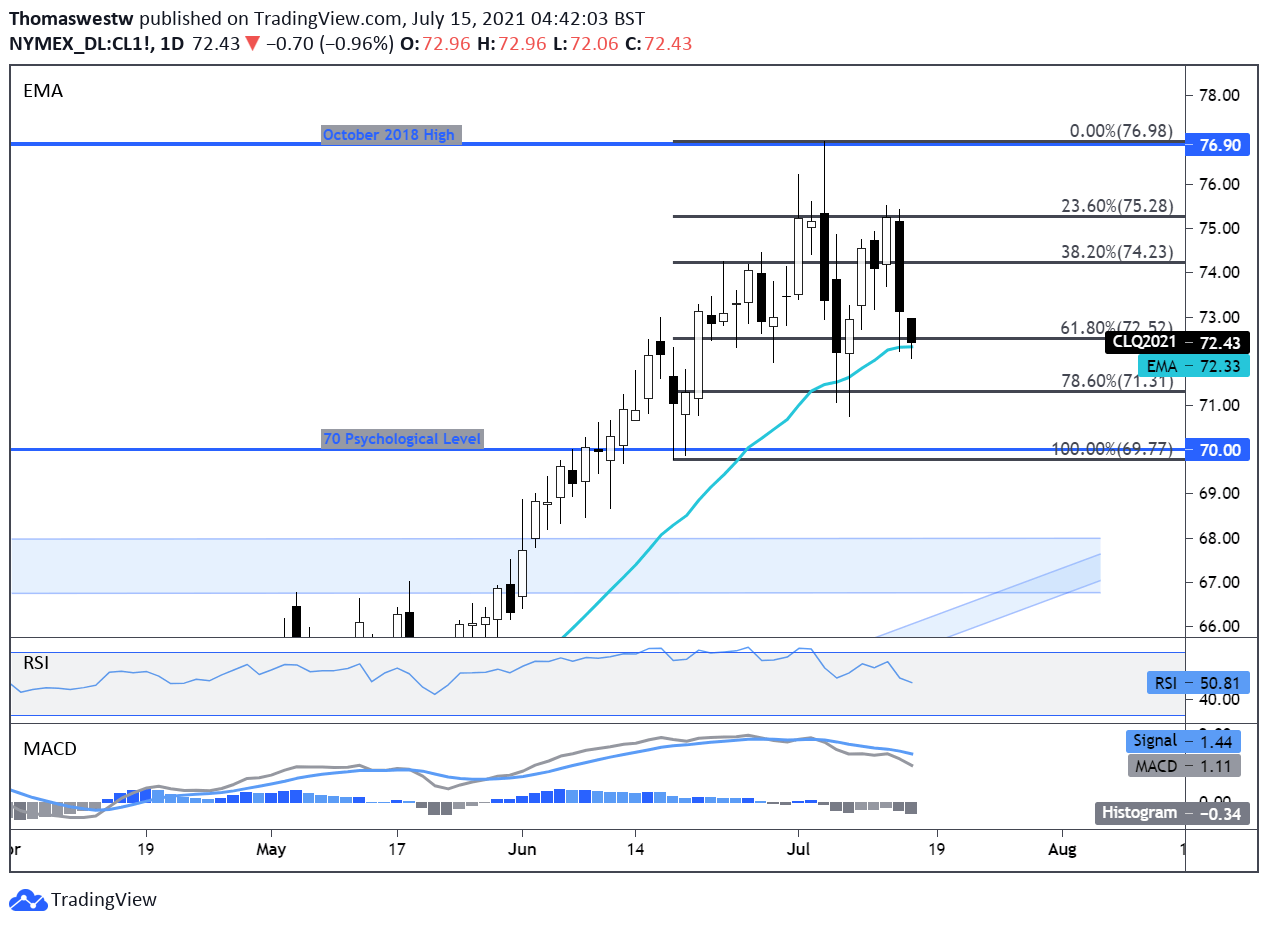
Chart created with TradingView
Disclaimer: See the full disclosure for DailyFX here.


