
Gold, Crude Oil Price Forecast: Edging Higher On The Back Of Stimulus, Saudi Oil Facility Attack
Gold prices bounced from a 9-month low and traded modestly higher during the APAC session on Monday after Senate Democrats passed the US$ 1.9 trillion Covid relief package. The bill will go to the House for approval on Tuesday before being sent to President Joe Biden’s desk for signing. The fruition of the long-anticipated fiscal stimulus is likely to bolster consumer spending, vaccine distribution and continuous unemployment aid, and therefore higher inflation expectations. The 5-year breakeven inflation rate has surged to 2.495% - a level not seen since before the 2008 subprime crisis. Gold has long been perceived as a good store of value and inflation hedge, therefore its price may be a lifted by rising inflation outlook.
Besides, there seems to be rising demand for safety after Saudi Arabia’s key oil facility in the Ras Tanura export terminal was attacked by a drone. The news not only sent oil prices to a fresh 12-month high, but also boosted gold prices due to rising geopolitical uncertainties in the Persian Gulf area.
A rapid surge in longer-dated Treasury yields has exacerbated the selloff in gold recently, with its price tumbling more than 5% over the past 8 trading sessions. The 10-year US Treasury yield climbed to a fresh 12-month high of 1.622% on March 5th before pulling off slightly. The rate reclimbed to 1.584% at the moment of writing, exerting downward pressure on precious metals. Fiscal stimulus-backed reflation hopes may lead yields to trend higher alongside inflation expectations, which appears to be bad news for bullion prices.
US real yields, represented by 10-year Treasury inflation-indexed security, stood at -0.658% on Monday, extending the upward trajectory as the rise in nominal yield surpassed the rise in inflation expectations. Real yields exhibit a historically negative correlation with gold prices, and their inverse relationship can be visualized in the graph below. Further rises in real yields may serve to undermine gold, which is non-yielding.
Gold Prices vs. 10-Year Treasury Inflation-Indexed Security
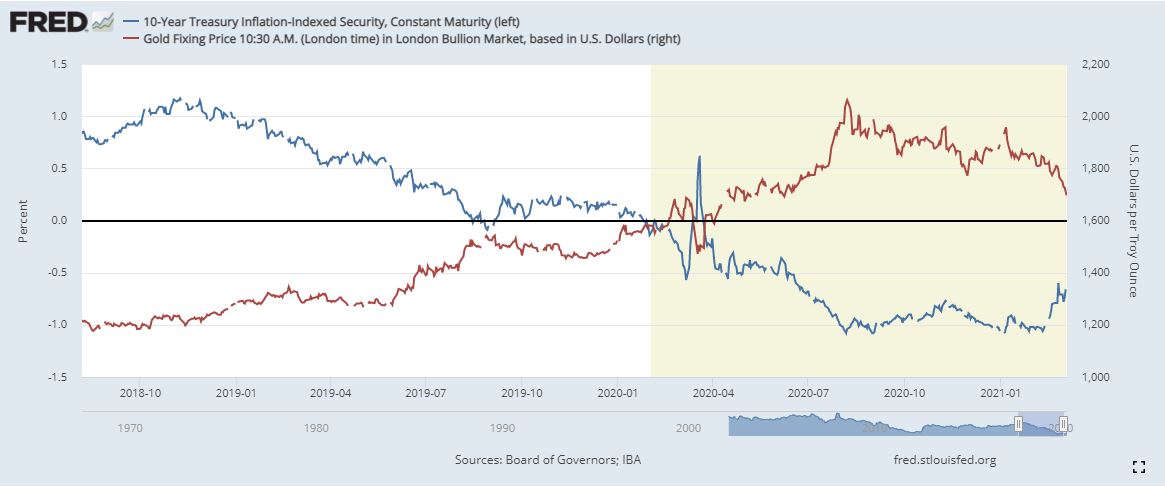
Source: FRED
Crude oil prices extended higher on Monday after Saudi Arabia said a storage tank in the Ras Tanura export terminal was attacked by a drone. WTI jumped 1.6% to US$ 67.36 at the moment of writing, and Brent surged above the US$ 70.00 mark for the first time since January 2020. Although the attack exposed the vulnerability of Saudi Arabia’s most important oil facility, output appeared to be unaffected after the drones and missiles were intercepted. The knee-jerk reaction may soon abate, brining focus back to energy demand recovery and supply restraint.
Oil prices were also boosted by the surprising move by the OPEC+ coalition to keep the current output level unchanged at a meeting last week, while many traders anticipated a production hike. Saudi Arabia, the leader of the oil cartel, decided to extend its unilateral 1 million barrel per day production cut into April.
The Senate approval of President Joe Biden’s large fiscal stimulus package further fueled oil bulls, with more household spending and a faster pace of vaccine distribution potentially brightening the energy demand outlook.
Gold Price Technical Analysis
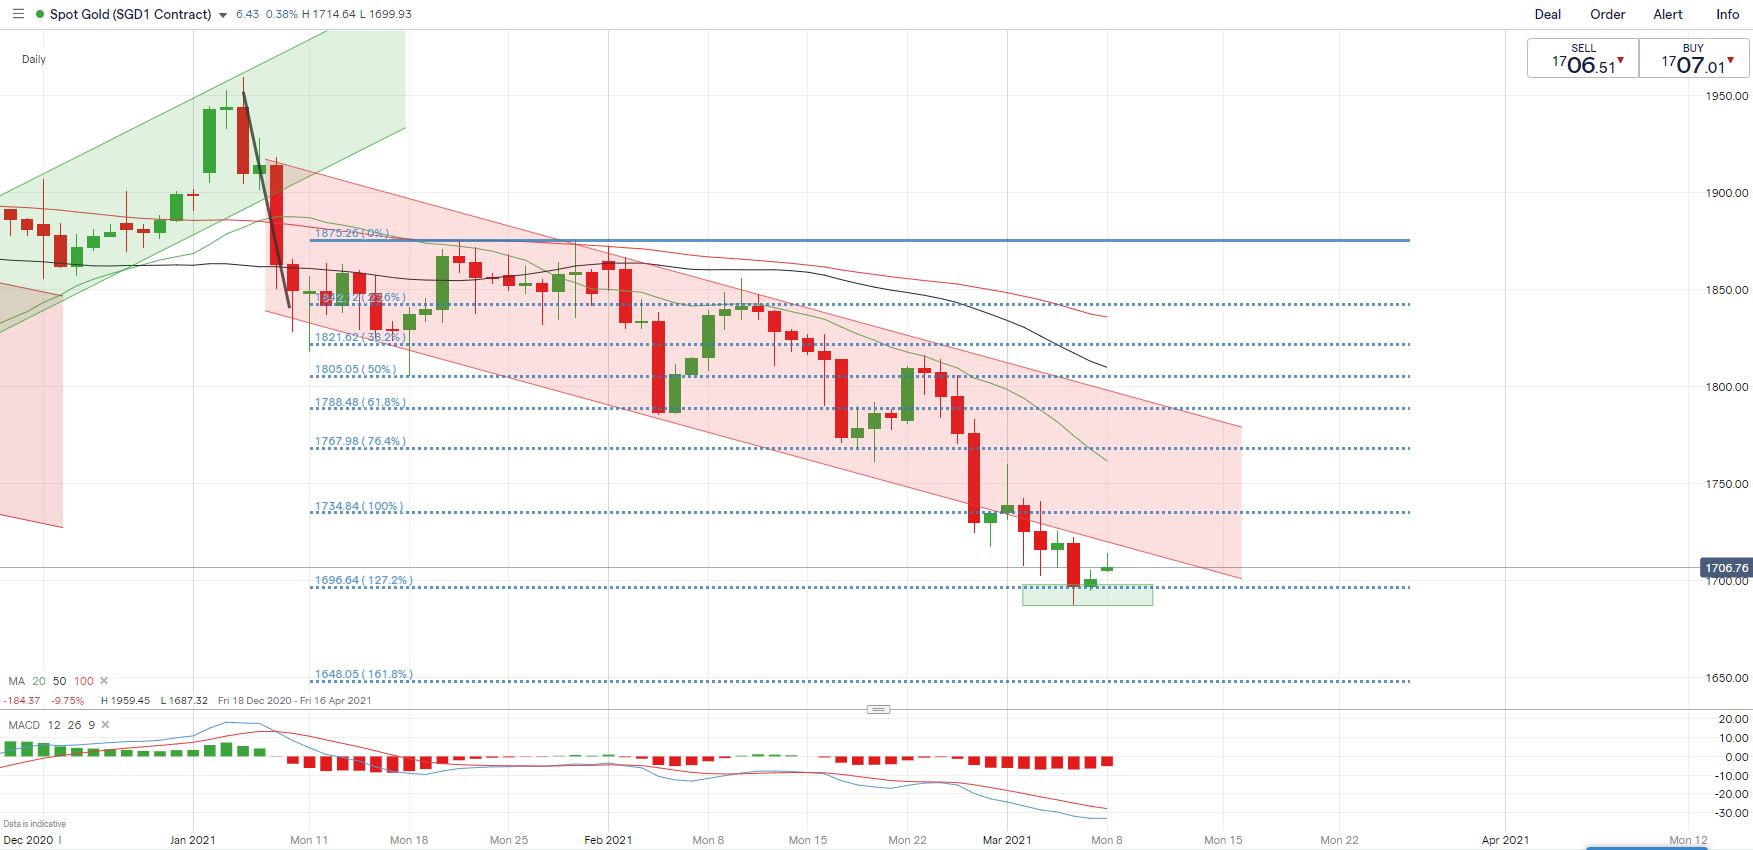
Gold prices are riding a dominant bearish trend lower, with all three Simple Moving Average (SMA) lines sloping downwards. Prices have broken below the “Descending Channel” last week, pointing to exacerbated selling pressure. An immediate support level can be found at US$ 1,696 – the 127.2% Fibonacci extension, breaking which may expose the 161.8% Fibonacci extension level (US$ 1,648) and thus open the door for further downside potential. The MACD indicator is trending lower beneath the neutral midpoint, suggesting that bearish momentum is dominating.
Gold Price – Daily Chart
(Click on image to enlarge)
Crude Oil Price Technical Analysis
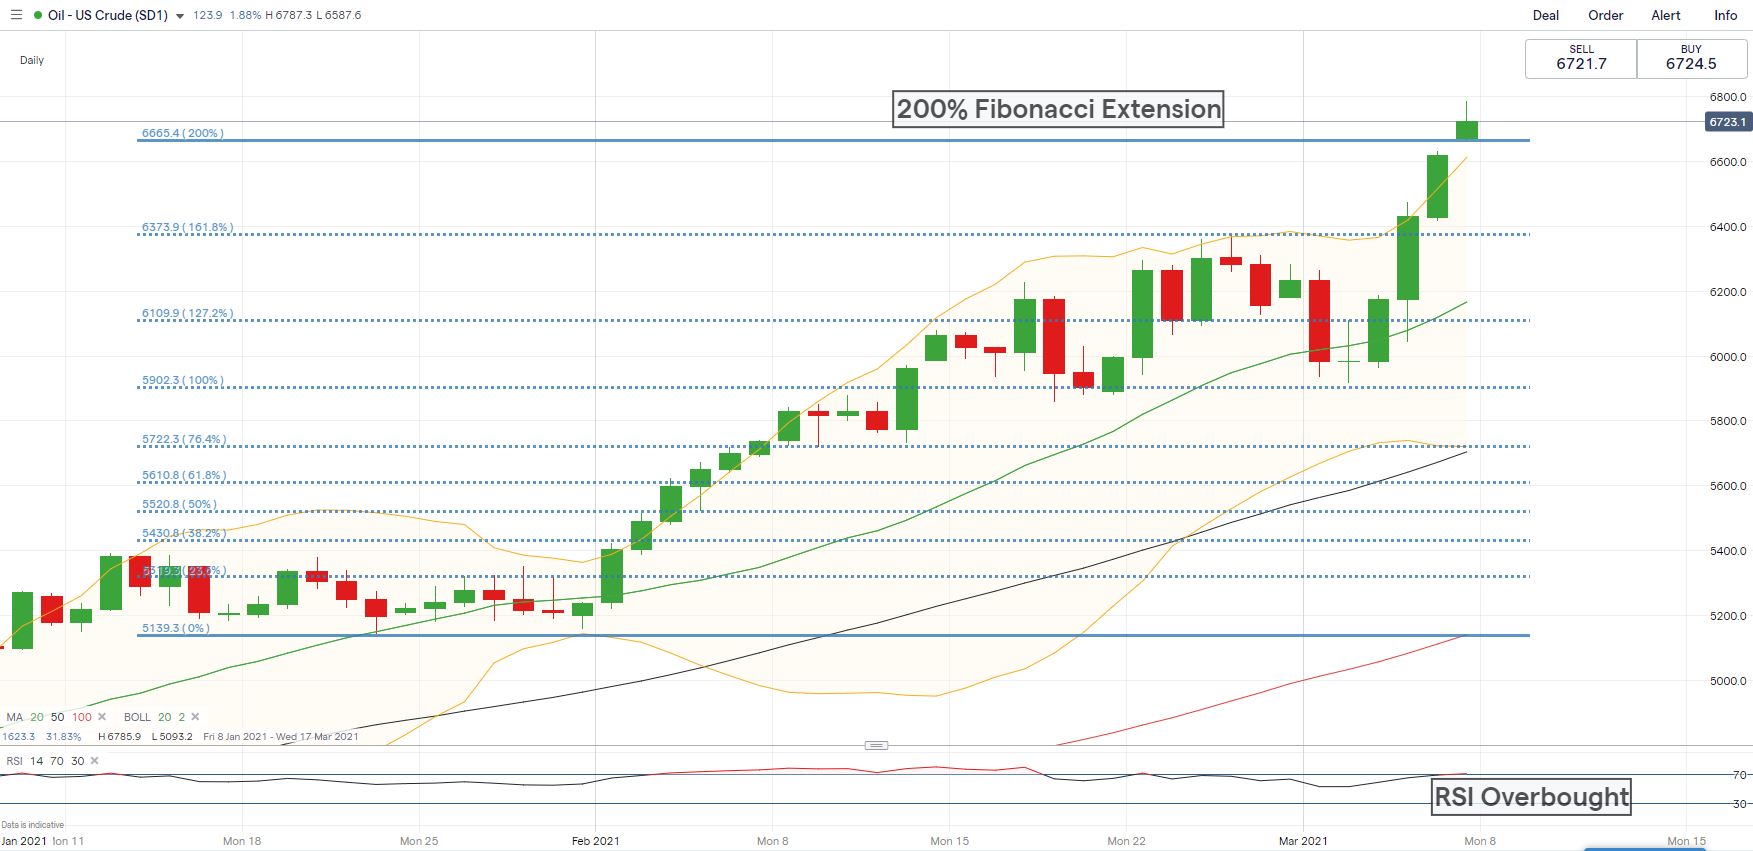
Crude oil prices extended above the 200% Fibonacci extension level (66.65) with strong upward momentum. Prices pierced through the upper Bollinger Band for a second day, hinting at risk of a temporary pullback as the rally appears to be overdone. The RSI indicator also surged beyond the 70.0 mark- an overbought threshold. The overall trend remains bullish-biased, as suggested by the formation of consecutive higher highs and higher lows. The moving average lines are trending higher nicely, underpinning the dominant bull trend.
Crude Oil Price – Daily Chart
(Click on image to enlarge)
Disclosure: See the full disclosure for DailyFX here.


