
Gold, Crude Oil Forecast: Rising Yields And Stronger USD Exert Pressure
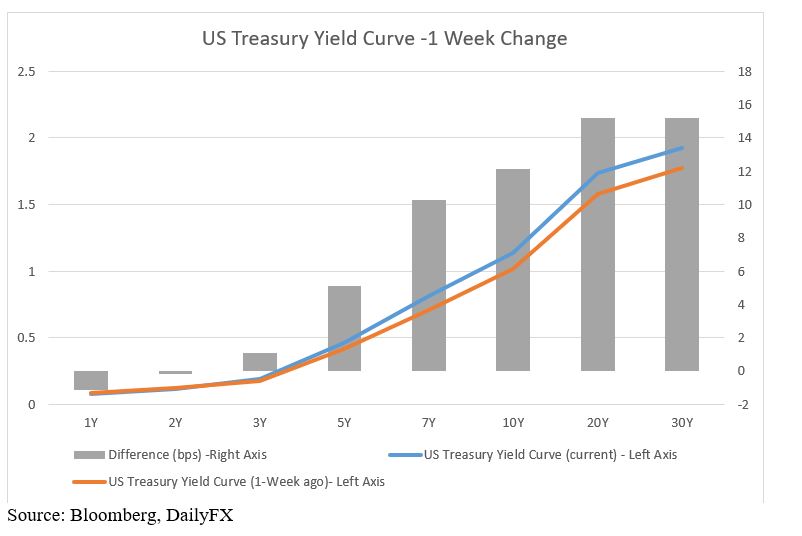
Gold and WTI crude oil prices both traded lower during Wednesday’s APAC session, as the US Treasury yields climbed to their highest level seen in almost a year. The 5-, 10-, and 20-Year rates rose by 5bps, 12bps and 15bps respectively from a week ago on reflation hopes, leading the Treasury yield curve to steepen further (chart below). This is negative to non-yielding asset classes like the precious metals, as the opportunity cost of holding them becomes higher.
The DXY US Dollar Index rebounded from a two-week low to 90.64, exerting further pressure on gold and crude oil prices. Meanwhile, investors are waiting for the minutes of the January FOMC meeting for clues into the Federal Reserve’s policy guidance. A more dovish-than-expected stance from policymakers may lead the US Dollar lower and probably provide gold prices some support.
Source: Bloomberg, DailyFX
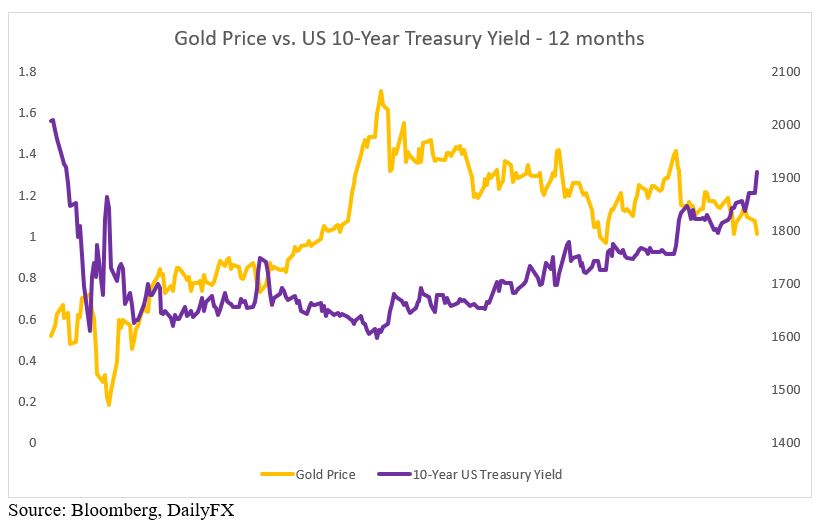
Renewed stimulus hopes led longer-dated US Treasury yields to climb as expectations for future demand, output and inflation rose. The 10-year rate surged above the 1.30% mark for the first time in eleven months, exerting downward pressure over precious metal prices, which are non-yielding. Their historic negative relationship can be visualized in the chart below. Looking ahead, an impending US fiscal stimulus package, improving pandemic situations, as well as a brighter economic outlook may lead yields to rise further and thus suppress gold prices.
Source: Bloomberg, DailyFX
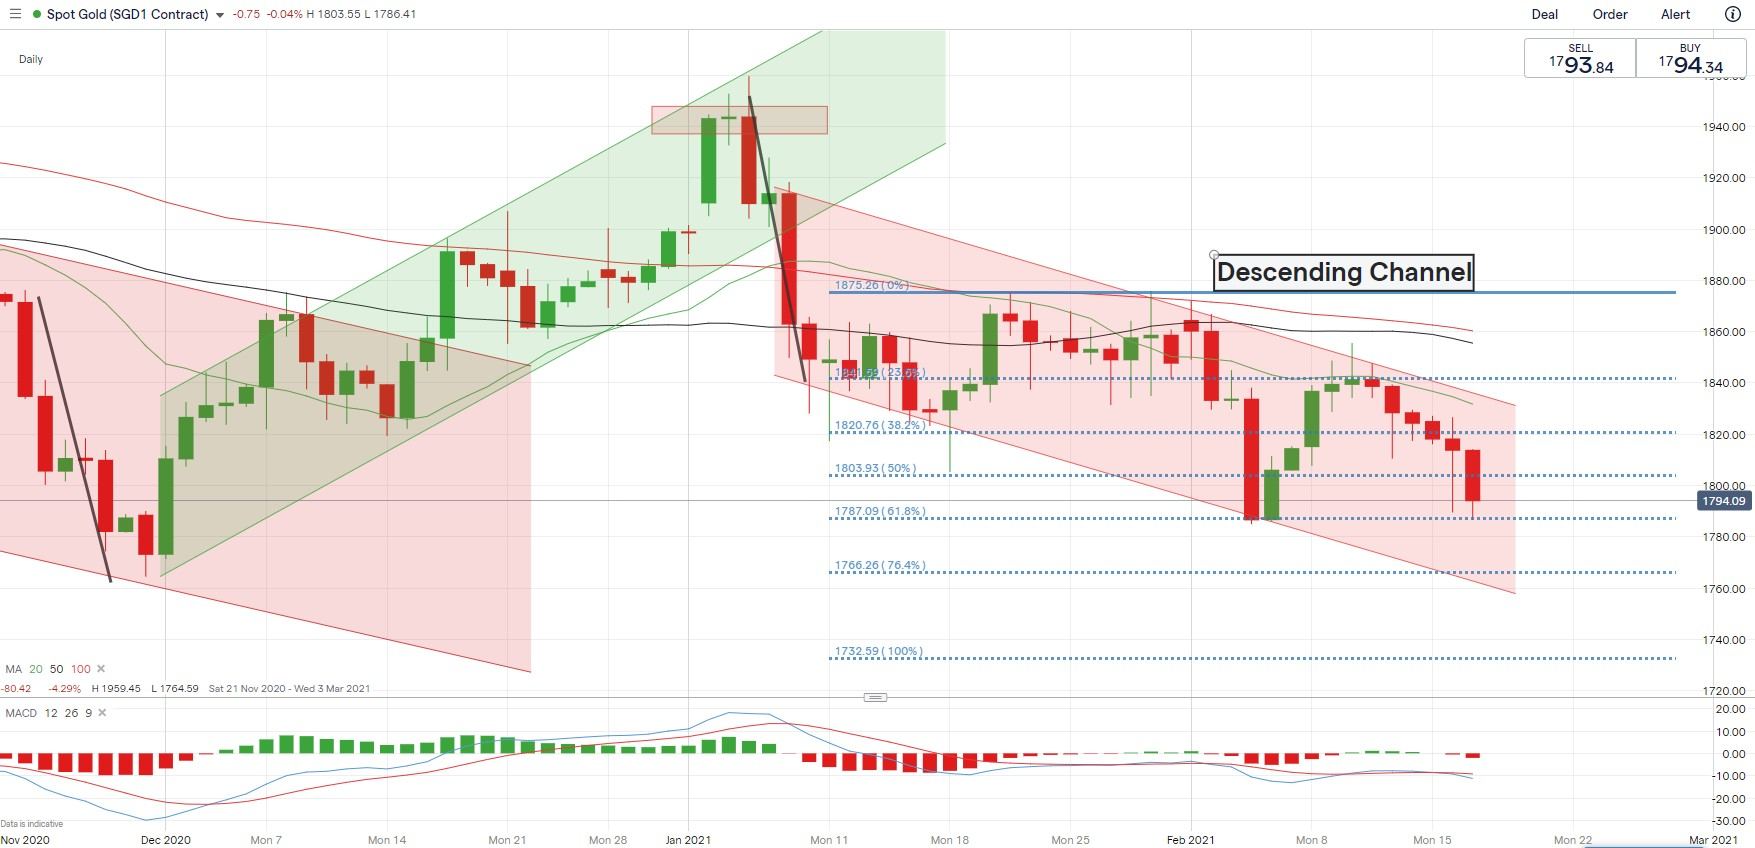
Technically, gold prices extended lower within a “Descending Channel” formed in early January. Prices tested an immediate support level at US$ 1,787 ( the 61.8% Fibonacci extension) and have since rebounded. The overall trend remains bearish-biased, as suggested by the downward-sloped simple moving average lines as well as a bearish MACD crossover. A breakdown below US$ 1,787 may lead to further losses with an eye on US$ 1,766 (76.4% Fibonacci extension).
Gold Price – Daily Chart
(Click on image to enlarge)
Crude Oil Price Outlook:
WTI crude oil prices hovered near 12-month highs as markets digested news about a major oil production disruption in Texas due to a cold blast that resulted in power cuts across the central and southern parts of the US. Extreme weather has likely disrupted more than 3.5 million barrels a day of output, according to Bloomberg. The impact on crude oil prices will largely depend on how long the power crisis will last, but eventually prices will likely return to the fundamentals with a focus on the global energy demand and OPEC+.
The US has vaccinated 52.88 million people, nearly double the total number of Covid-19 infections in the country (27.8 million). The 7-day average of daily new cases has fallen to 85,785 on February 15th from a peak of 259,564 seen on January 8th, marking a rapid decline in new infections with the rollout of vaccines. This trend may hint at a faster removal of lockdowns and normalization in business activity, buoying crude oil prices.
The EIA will release the DOE crude oil inventory data on February 18th, in which markets foresee a 2.00-million-barrel drop in stockpiles after a 6.65-million-barrel decline seen in the week before. Falling US crude inventories as of late reflect a pickup in demand as economic growth gains momentum. WTI has historically displayed a negative correlation with inventories, with a 12-month correlation coefficient of -0.506 (chart below).

Source: Bloomberg, DailyFX
Technically, WTI has likely formed an “Evening Star” candlestick yesterday before prices entered a brief consolidation. An “Evening Star” is used to predict future price reversals to the downside. The RSI indicator climbed into overbought territory above 70, suggesting that oil might be vulnerable to a technical pullback. The overall trend remains bullish-biased, as suggested by the upward-sloped moving average lines. However, some near-term volatility may be underway.
WTI Crude Oil – Daily Chart
(Click on image to enlarge)
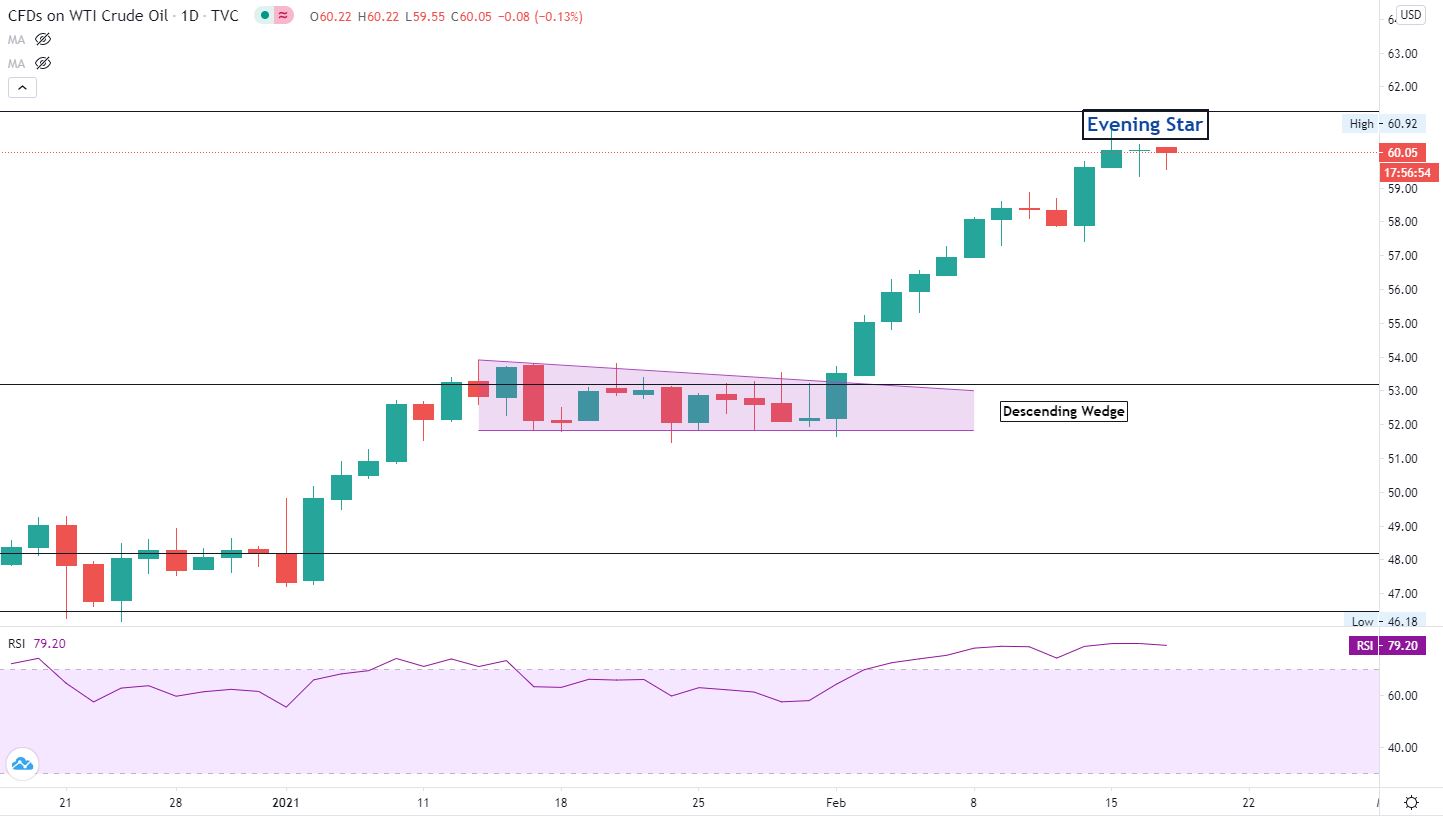
Chart by TradingView
Disclosure: See the full disclosure for DailyFX here.


