
Gold Breakout Triggers Buy Signal, Is $3000 Next Target?
(Click on image to enlarge)
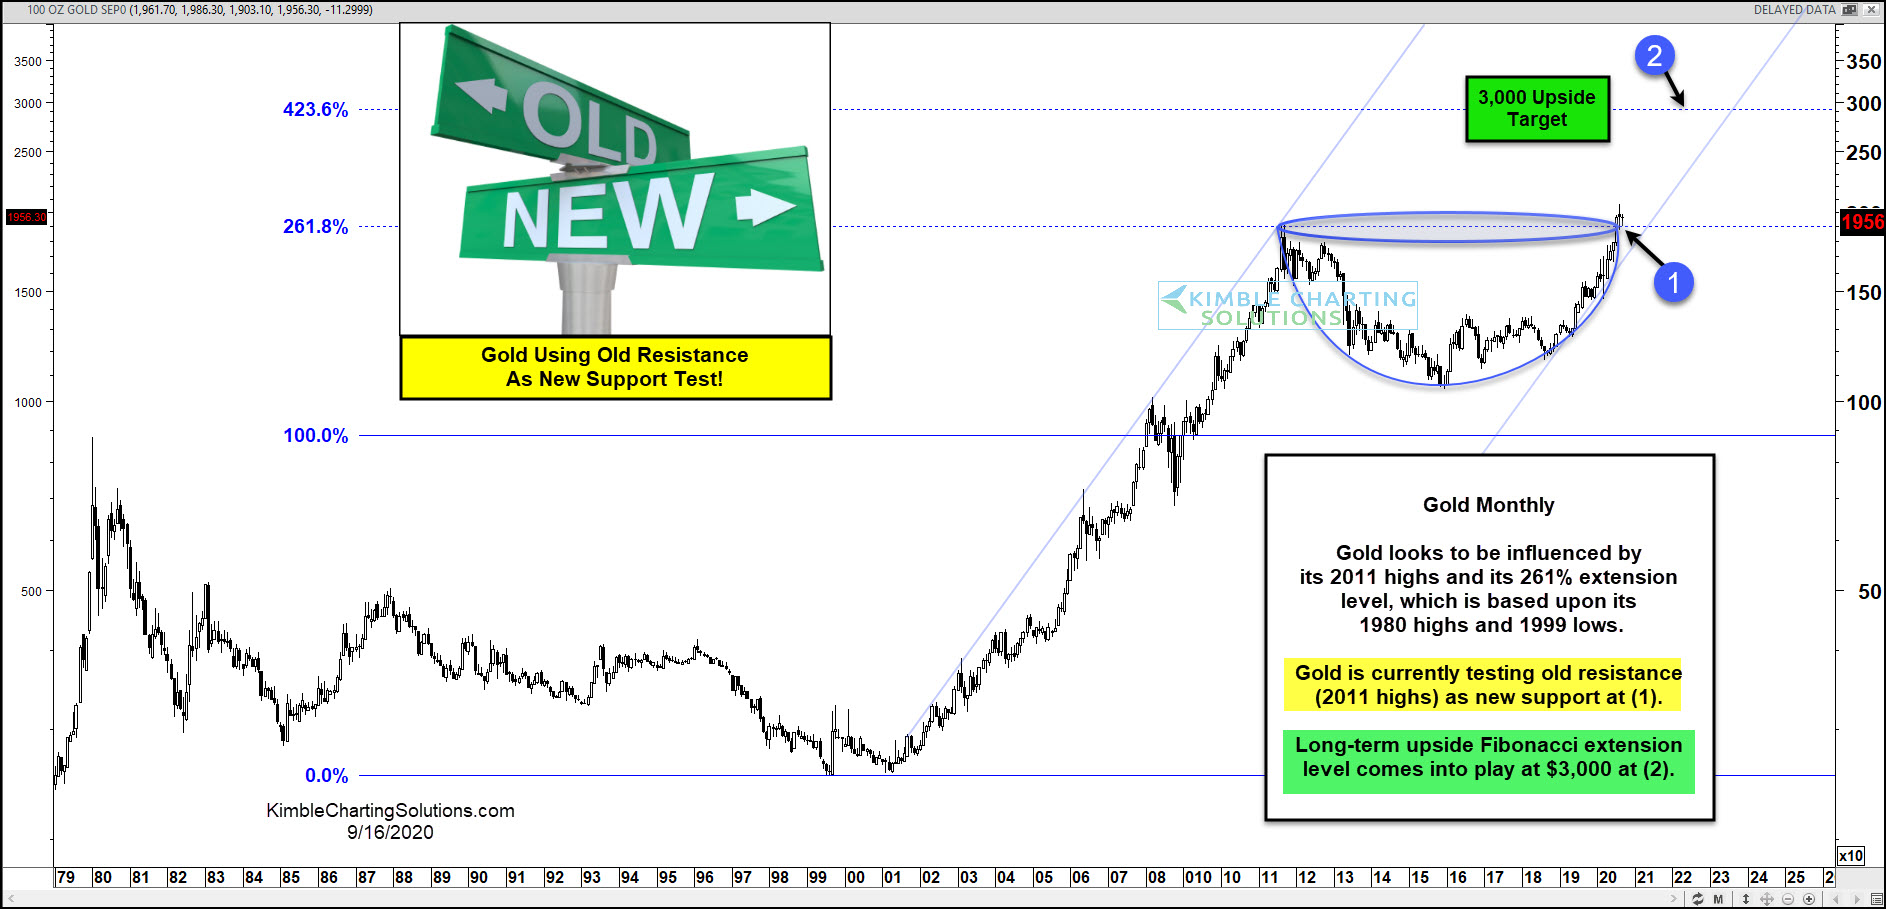
90-days ago this cup & handle pattern was discussed on See It Market when Gold was trading at 1717.
Fast-forward to today and Gold is up 15 percent. So it’s time for an update!
As we pointed out 90-days ago, the initial price magnet for the rally was the 261.8 Fibonacci extension that marked the 2011 high at (1).
That high has served as price resistance for nearly 9 years! …But it may be turning into support now.
Gold has rallied sharply up the right side of the pattern and pushed past its 2011 highs. In fact, the “monthly” candle is currently attempting to break out, and should it hold, would target the next Fibonacci extension at (2).
As we pointed out 90-days ago, that target comes in at $3,000!
Disclosure: Sign up for Chris's Kimble Charting Solutions' email alerts--click here.


