
Gold Breakout On Hold As Prices Return To Range, Volatility Drops
The return of uncertainty over the US-China trade war negotiations initially proved bullish for safe haven assets like the Japanese Yen and US Treasuries. But amid a return of US Dollar strength alongside the bid in safe havens, gold prices have been hobbled in recent days, effectively neutralizing bullion’s appeal during a time of risks seemingly rising everywhere around the globe.
Shortly after hitting an all-time low on May 3, GVZ, the measure of 1-month implied Gold volatility, rebounded to a four-week high as new developments in the US-China trade war spooked investors globally. While rising volatility is usually seen as a disconcerting development for prices, Gold benefits from rising volatility: higher levels of uncertainty increase the safe haven appeal of Gold.
GVZ (GOLD VOLATILITY) TECHNICAL ANALYSIS: DAILY PRICE CHART (MAY 2018 TO MAY 2019) (CHART 1)
(Click on image to enlarge)
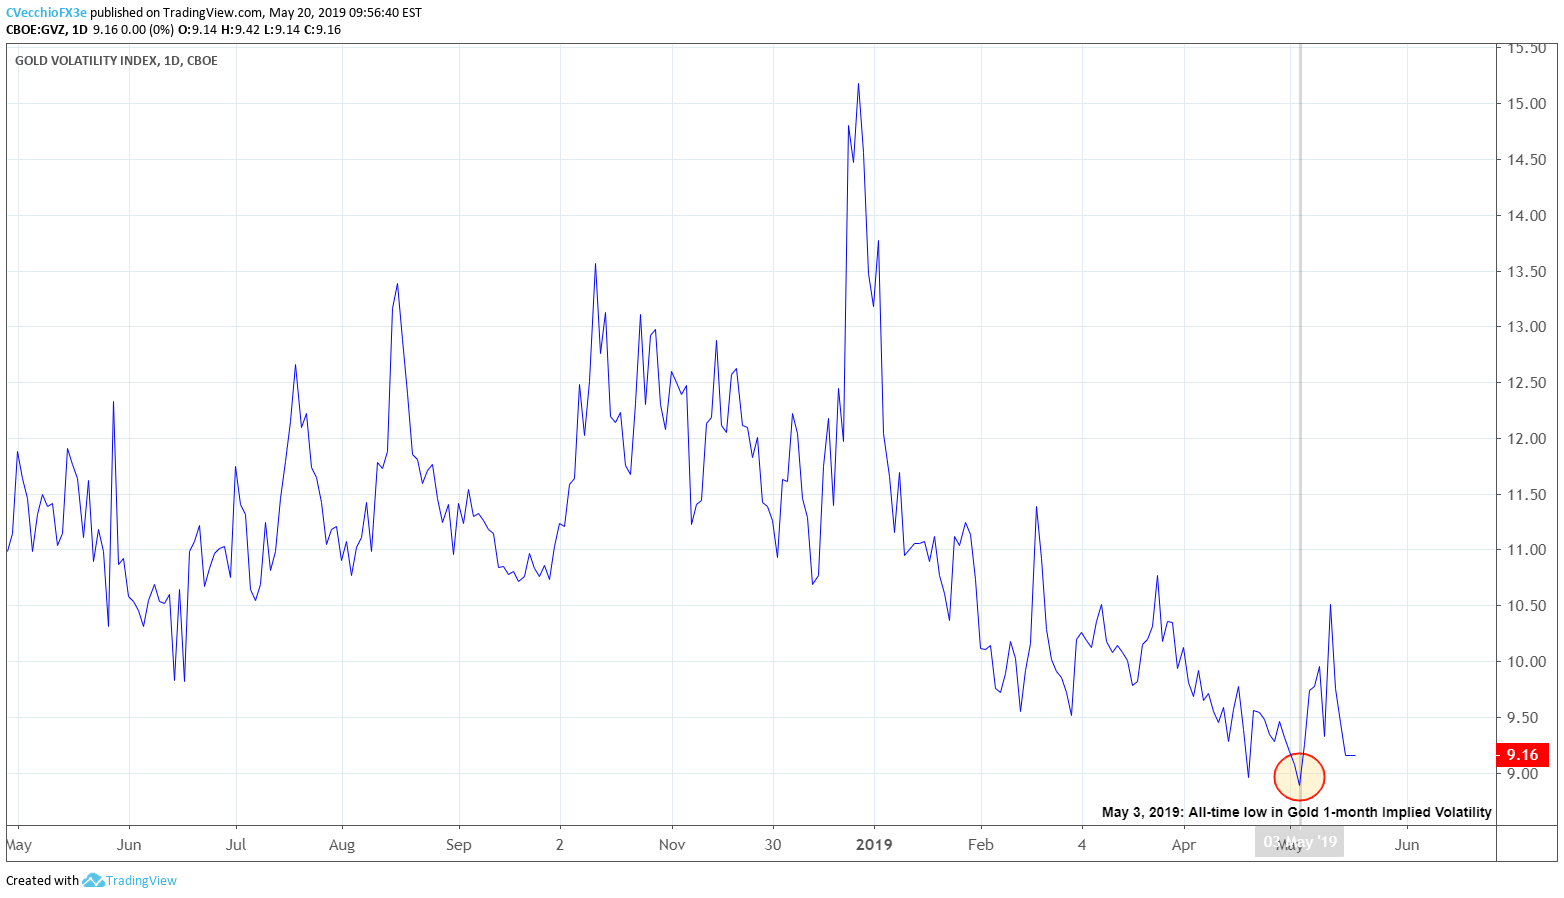
Keeping this in mind, the past few weeks have seen measures of Gold volatility fall, and in turn, the appeal of Gold wane. GVZ peaked on May 13, and Gold prices hit their monthly high the following day; as Gold volatility has quickly slumped back towards its all-time low, the Gold price breakout from early-May has failed in turn.
But with gold volatility falling against a backdrop of a strengthening US Dollar, gold prices finished last week back within the former range carved out between 1266.18 and 1288.58 from April 15 to May 13. Typically, when false breakouts occur, we see price return to the other side of the consolidation; we thus can’t rule out a further drop in gold prices towards the consolidation support.
GOLD PRICE TECHNICAL ANALYSIS: DAILY CHART (APRIL 2018 TO MAY 2019) (CHART 2)
(Click on image to enlarge)
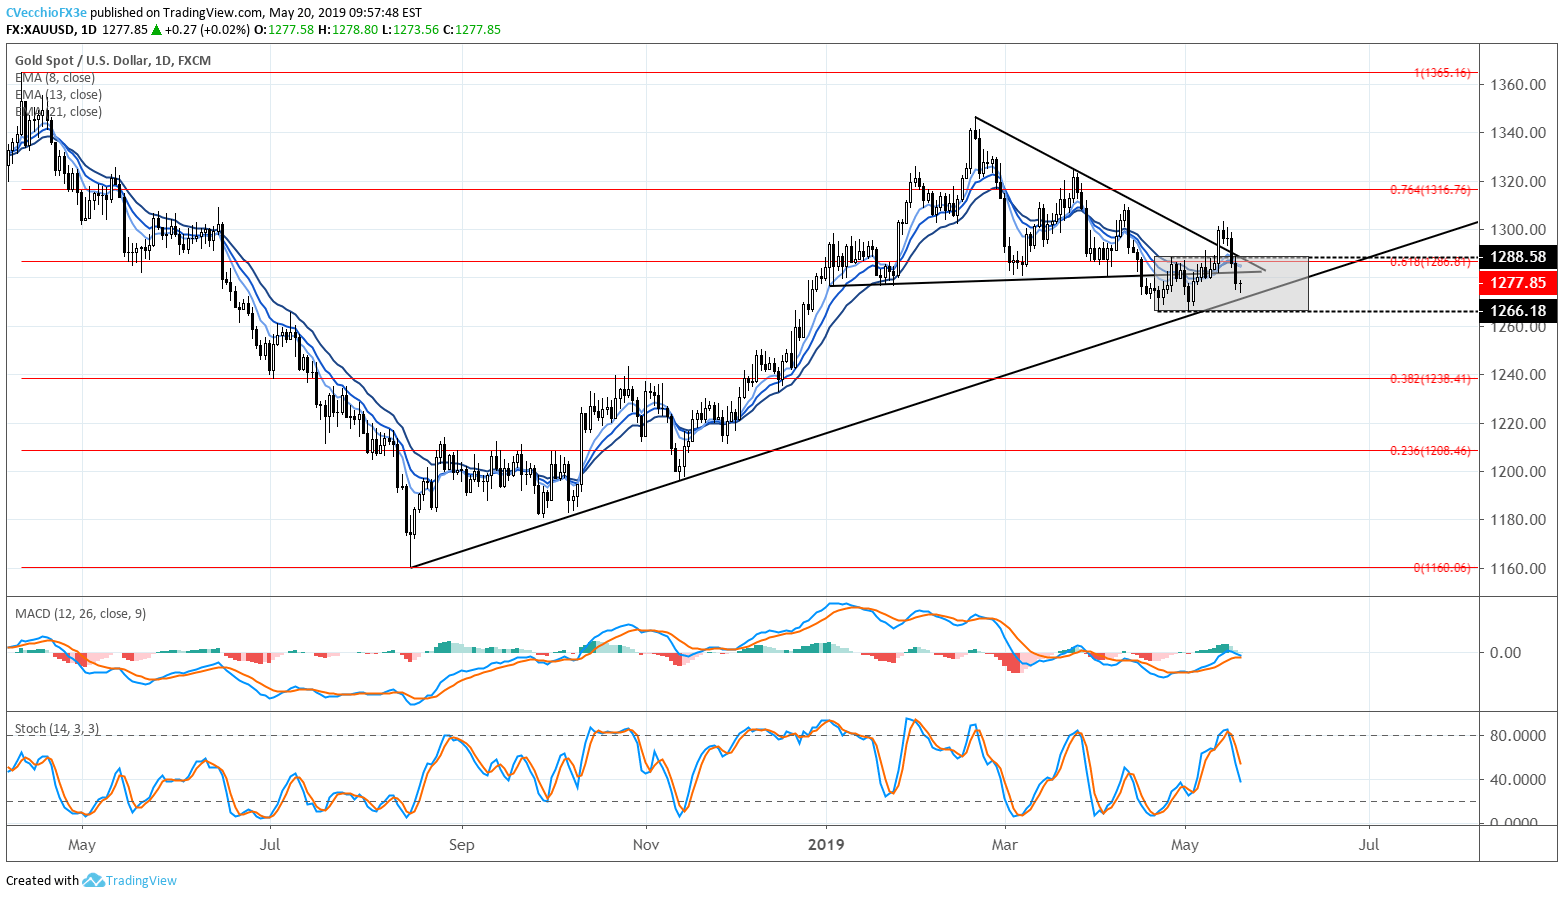
In early-May, gold prices attempted to climb through four-week consolidation resistance above 1288.58, and for several days, it appeared that a bullish breakout was gathering pace; the downtrend from the February and March swing highs was temporarily broken as well.
Nevertheless, the gold price forecast is still neutral so long as the range is in place; the breakout is on hold for now. Should gold prices move above 1288.58, we would again be looking at topside break of the consolidation as well as the downtrend from the February and March 2019 highs, while, a drop below 1266.18 would constitute a downside break of the consolidation as well as the uptrend from the late-2018 swing lows.
IG CLIENT SENTIMENT INDEX: SPOT GOLD PRICE FORECAST (MAY 20, 2019) (CHART 3)
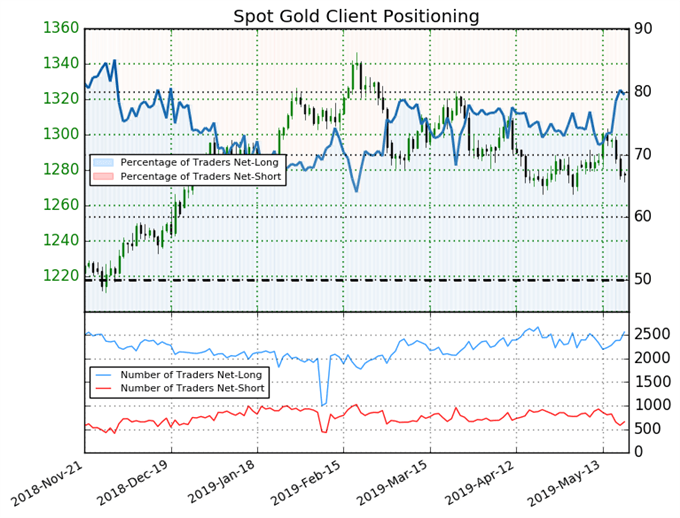
Spot gold: Retail trader data shows 79.5% of traders are net-long with the ratio of traders long to short at 3.89 to 1. The number of traders net-long is 10.2% higher than yesterday and 5.0% higher from last week, while the number of traders net-short is 7.0% higher than yesterday and 31.4% lower from last week.
We typically take a contrarian view to crowd sentiment, and the fact traders are net-long suggests spot gold prices may continue to fall. Traders are further net-long than yesterday and last week, and the combination of current sentiment and recent changes gives us a stronger spot gold-bearish contrarian trading bias.


