
Gold Breaking Seasonal Model
Gold is breaking the seasonal model of establishing a December low. Prices were on the verge of collapsing below the cycle trendline in November, but political uncertainty and economic concerns arrested the decline and gold continued higher.
The overall price structure resembles a corrective rebound that could peak within the next week or two. The 50% retracement of the April/August decline in gold triggers around $1267.
The stock market remains volatile over fears that trade negotiations with China are breaking down.
OPEC and Russia agreed to cut a combined 1.2-million barrels per day starting in January. That put a floor under oil, but I don’t think prices will bottom until early 2019.
The December 19th Fed meeting will determine much. Will Powell continue his dovish tone? How many hikes are scheduled for 2019? Will there be significant changes to the Fed dot-plot? The next 2-weeks are critical.
GOLD WEEKLY
For the last several years gold made its seasonal low in November/December. The pattern was primed for a 2018 repeat, but gold was unable to break the cycle trendline in November. Political uncertainty and weak stock prices prevented the November breakdown. Now we have to figure out what’s next.
The Overall Technical Assessment:
There was a clear downtrend from April to August. Gold lost $200 in 18-weeks. Since the August low, prices have been rebounding…nothing explosive, just a gradual stair-stepping higher; a technical correction. Prices are now entering resistance between the 50-week EMA and 50% retracement level ($1267). Corrective rebounds often terminate near the 50% retracement. Timing wise the April/August decline took 18-weeks. It’s possible this rebound employs a similar 18-week timeframe which corresponds with the December 19th Fed meeting.

In a nutshell, I think there is a pretty good chance gold tops within the next week or two. We are meeting the technical benchmarks in time and price for a rebound or corrective retracement. Gold would have to close above $1310 in December or January to invalidate the bearish setup and establish a new bull run.
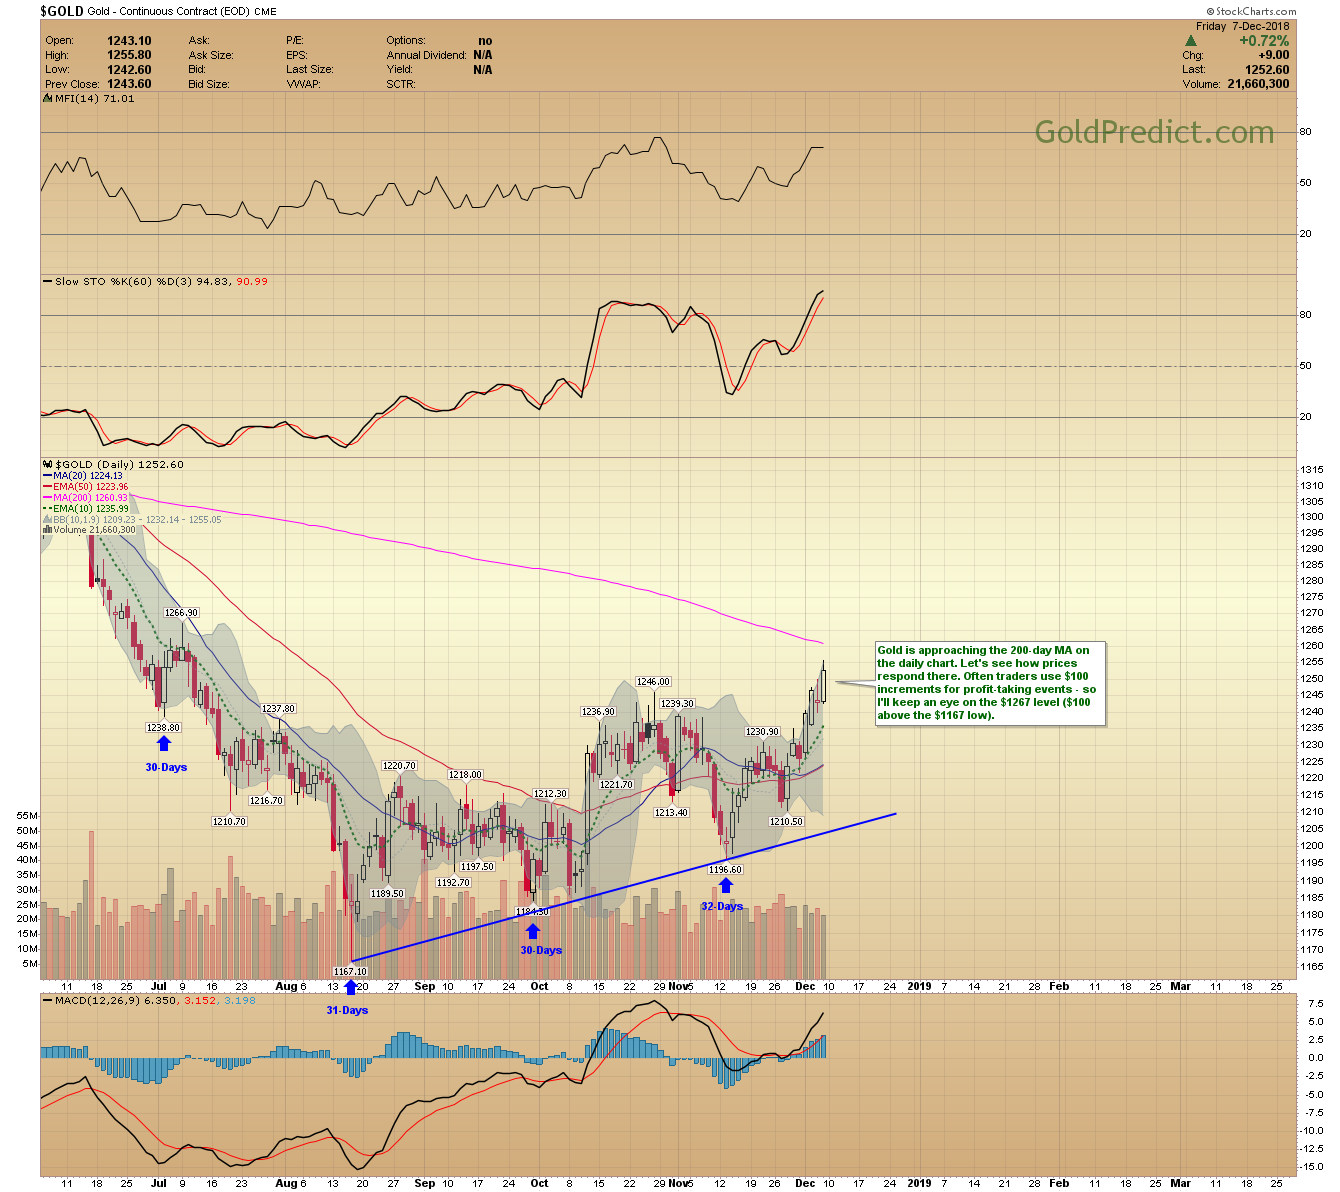
GOLD DAILY
Gold is approaching the 200-day MA on the daily chart. Let’s see how prices respond there. Often traders use $100 increments for profit-taking events – so I’ll keep an eye on the $1267 level ($100 above the $1167 low).
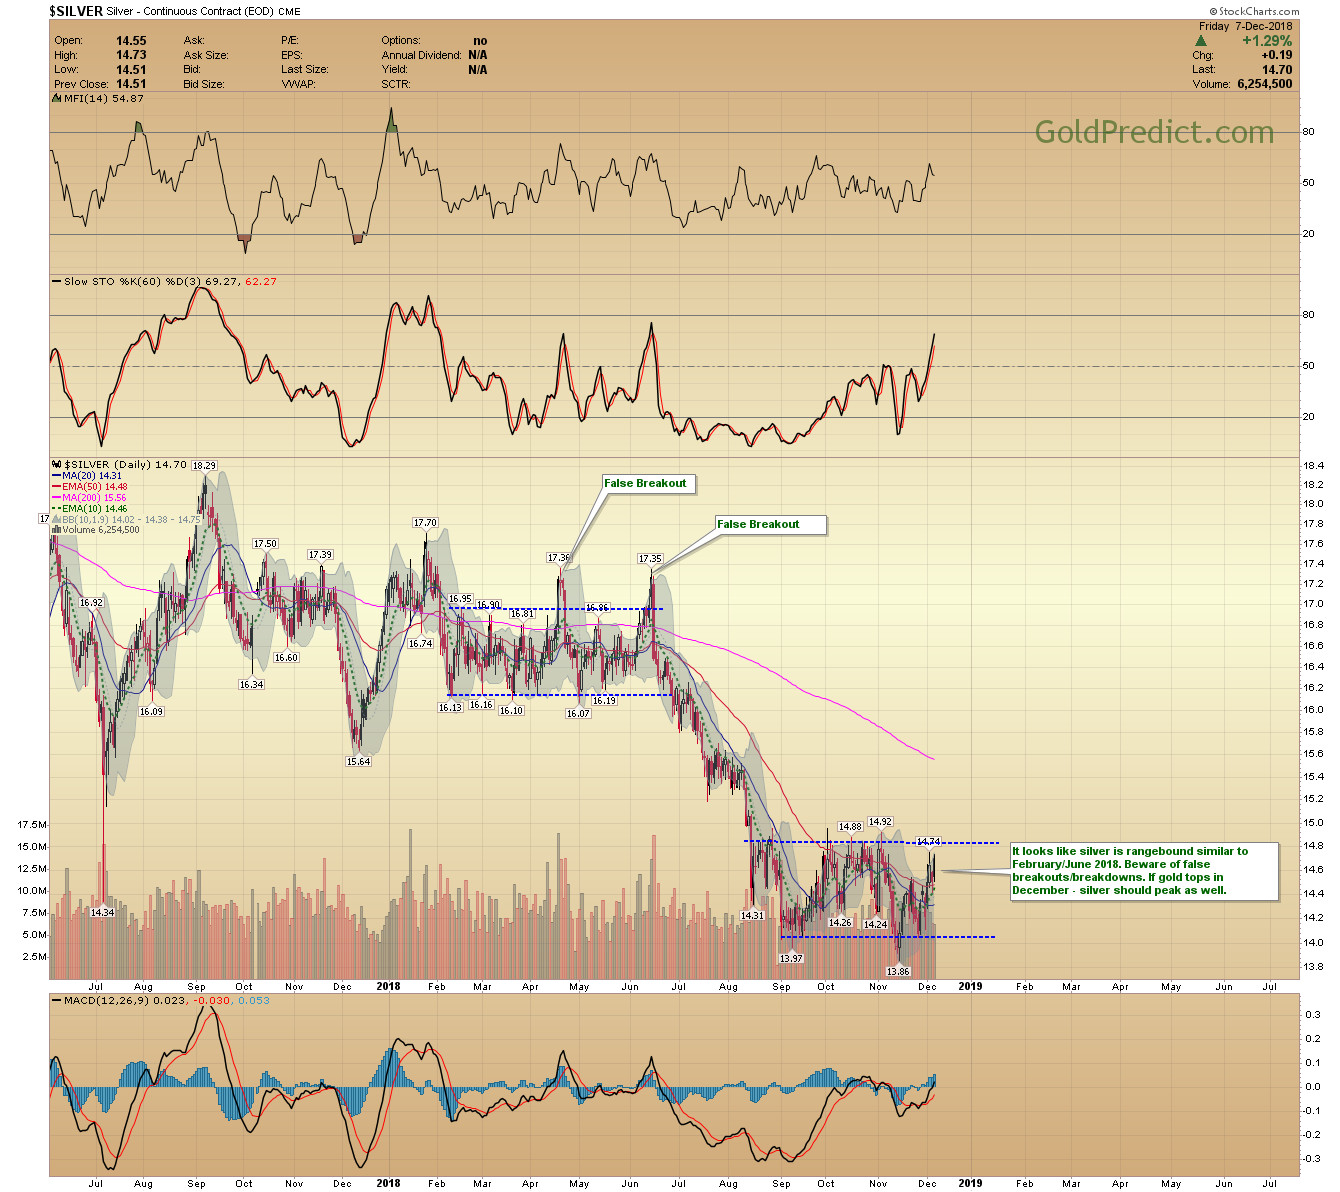
-ILVER DAILY
It looks like silver is rangebound similar to February/June 2018. Beware of false breakouts/breakdowns. If gold tops in December – silver should peak as well.
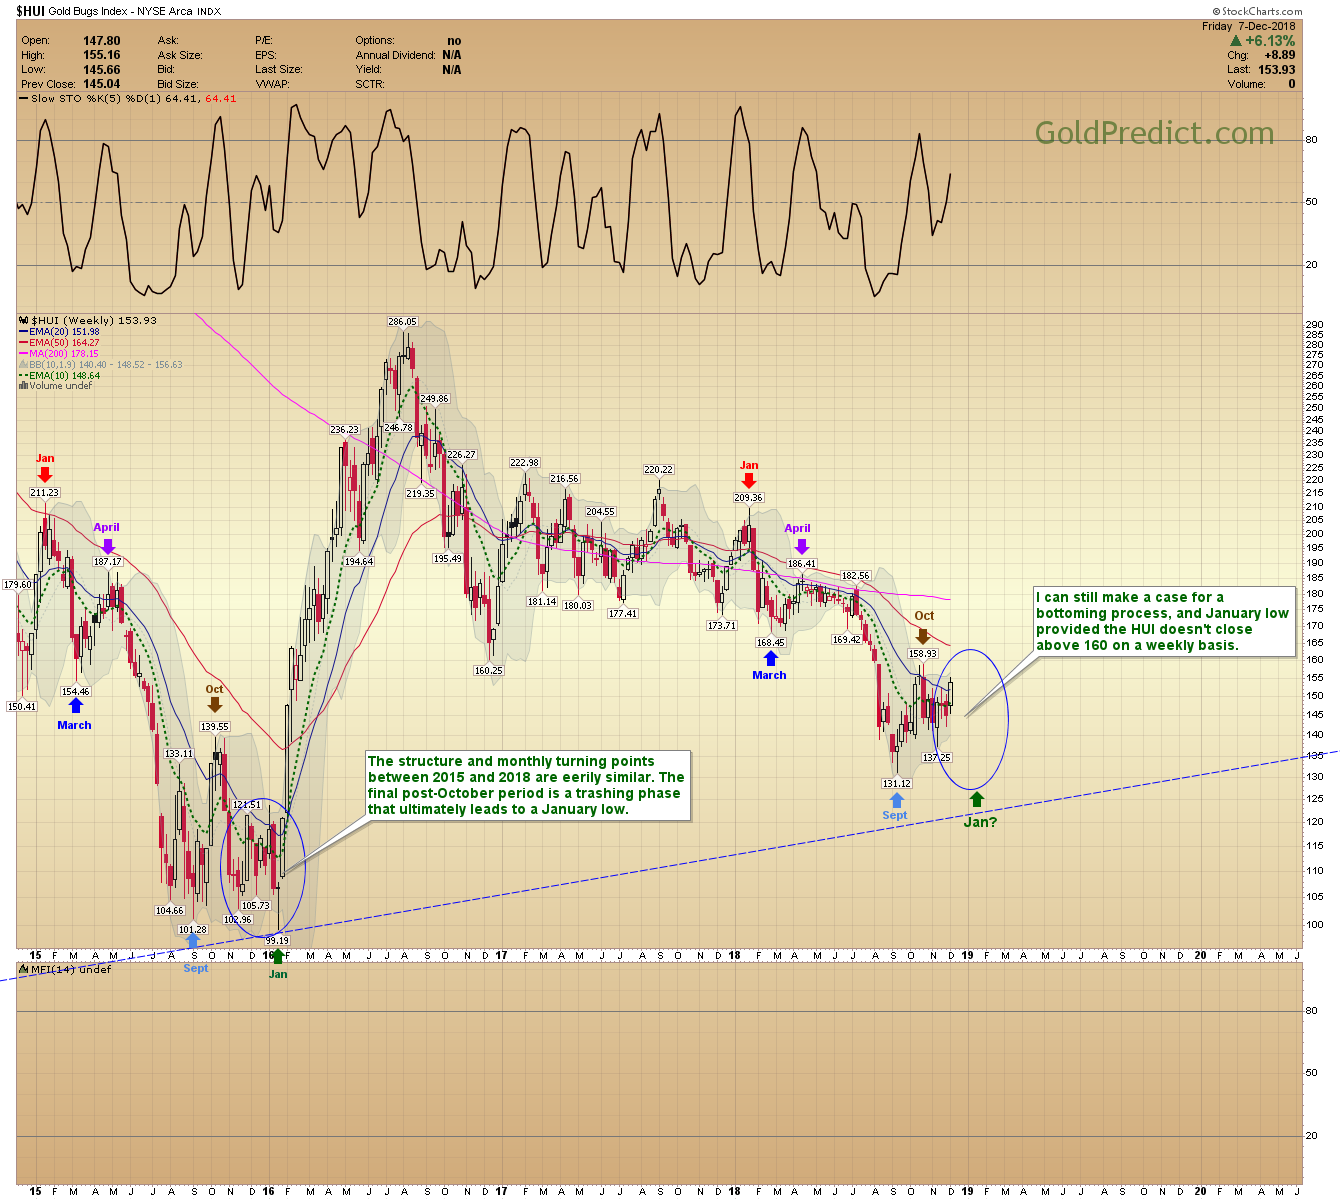
HUI WEEKLY
The structure and monthly turning points between 2015 and 2018 are eerily similar. The final post-October period is a trashing phase that ultimately leads to a January low. I can still make a case for a bottoming process, and a January low provided the HUI doesn’t close above 160 on a weekly basis.
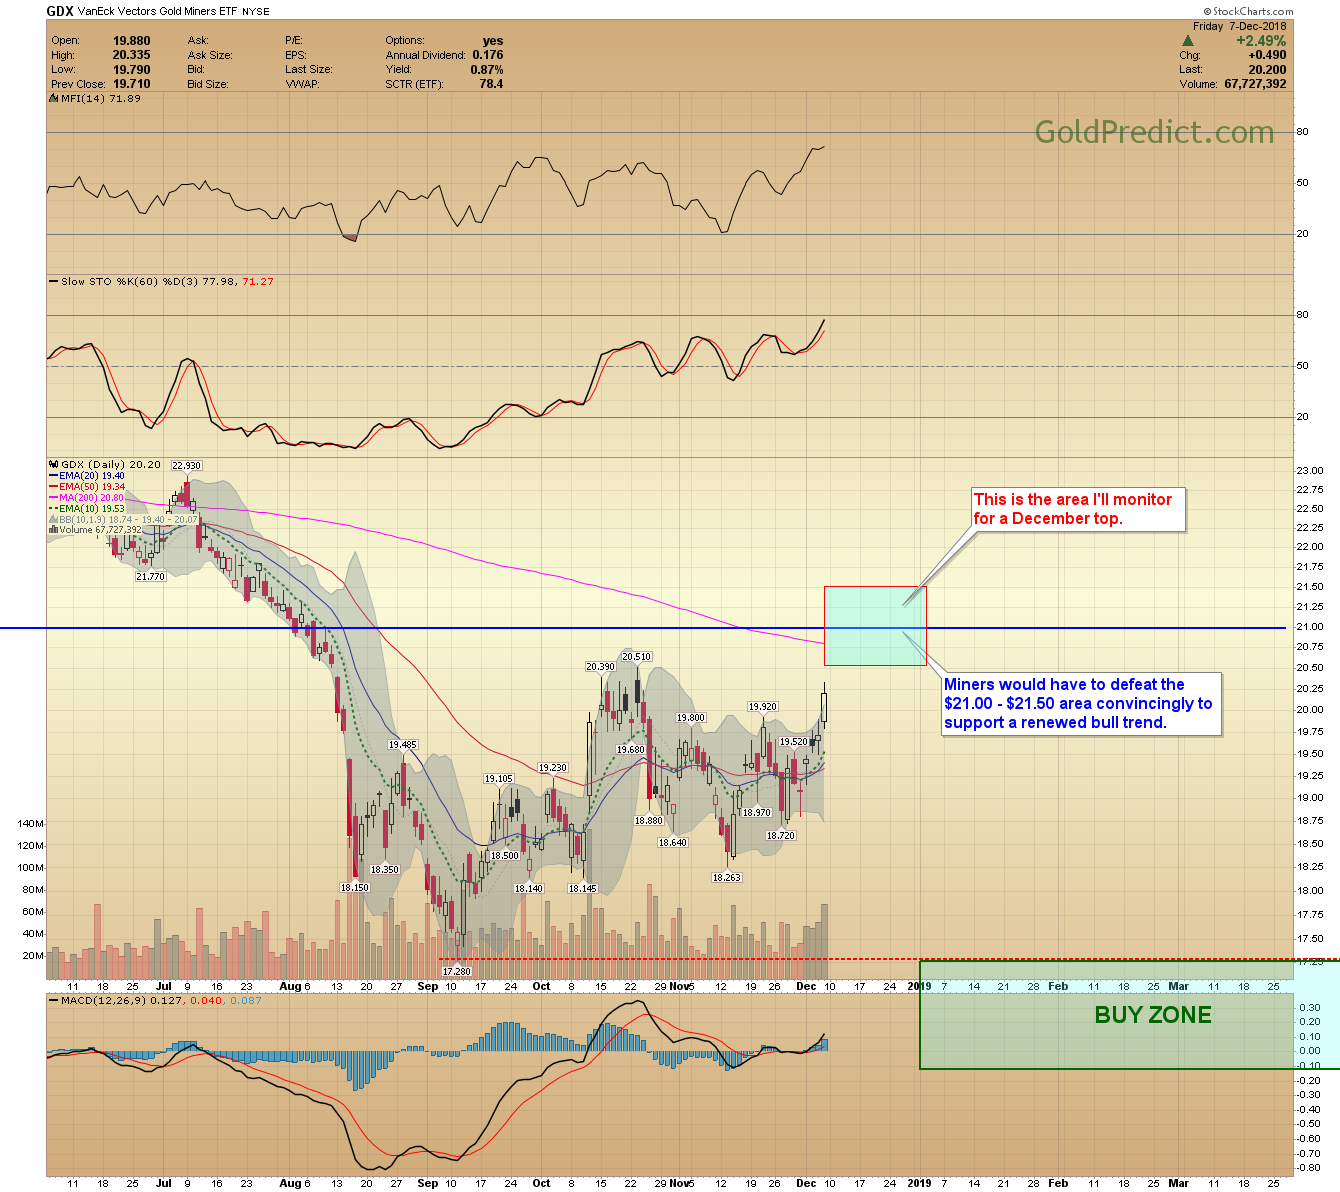
GDX
This is the area I’ll monitor for a December top. Miners would have to defeat the $21.00 – $21.50 area convincingly to support a renewed bull trend. Note: There was selling on strength of 192 million in GDX on Friday.
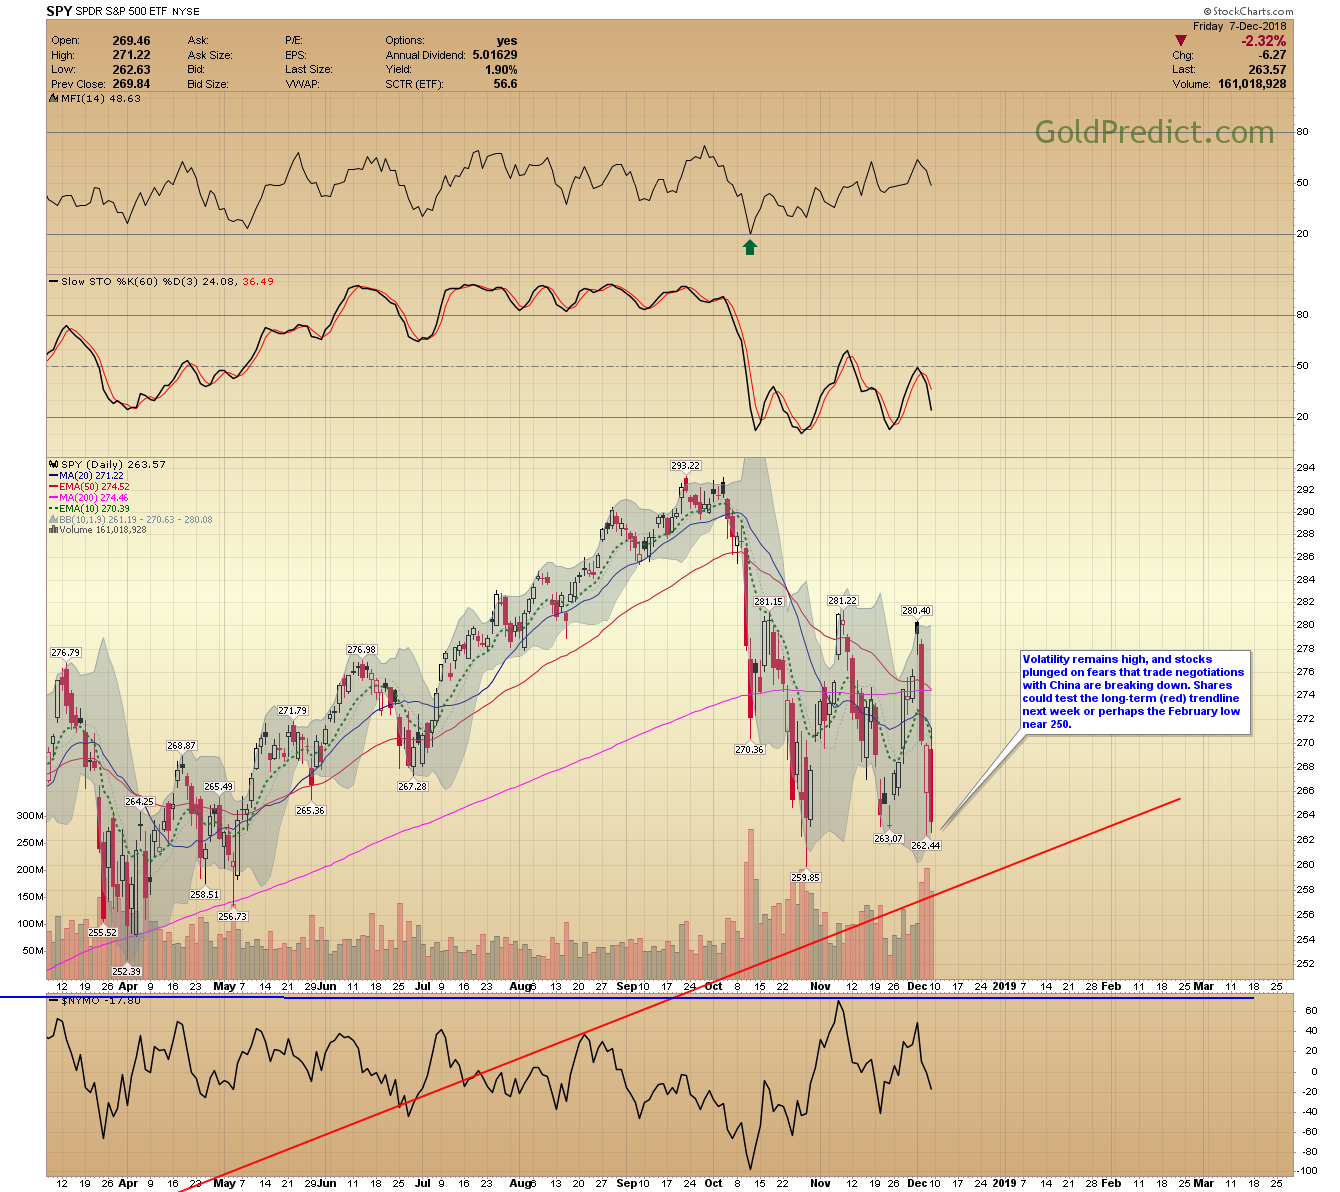
SPY
Volatility remains high, and stocks plunged on fears that trade negotiations with China are breaking down. Shares could test the long-term (red) trendline next week or perhaps the February low near 250.
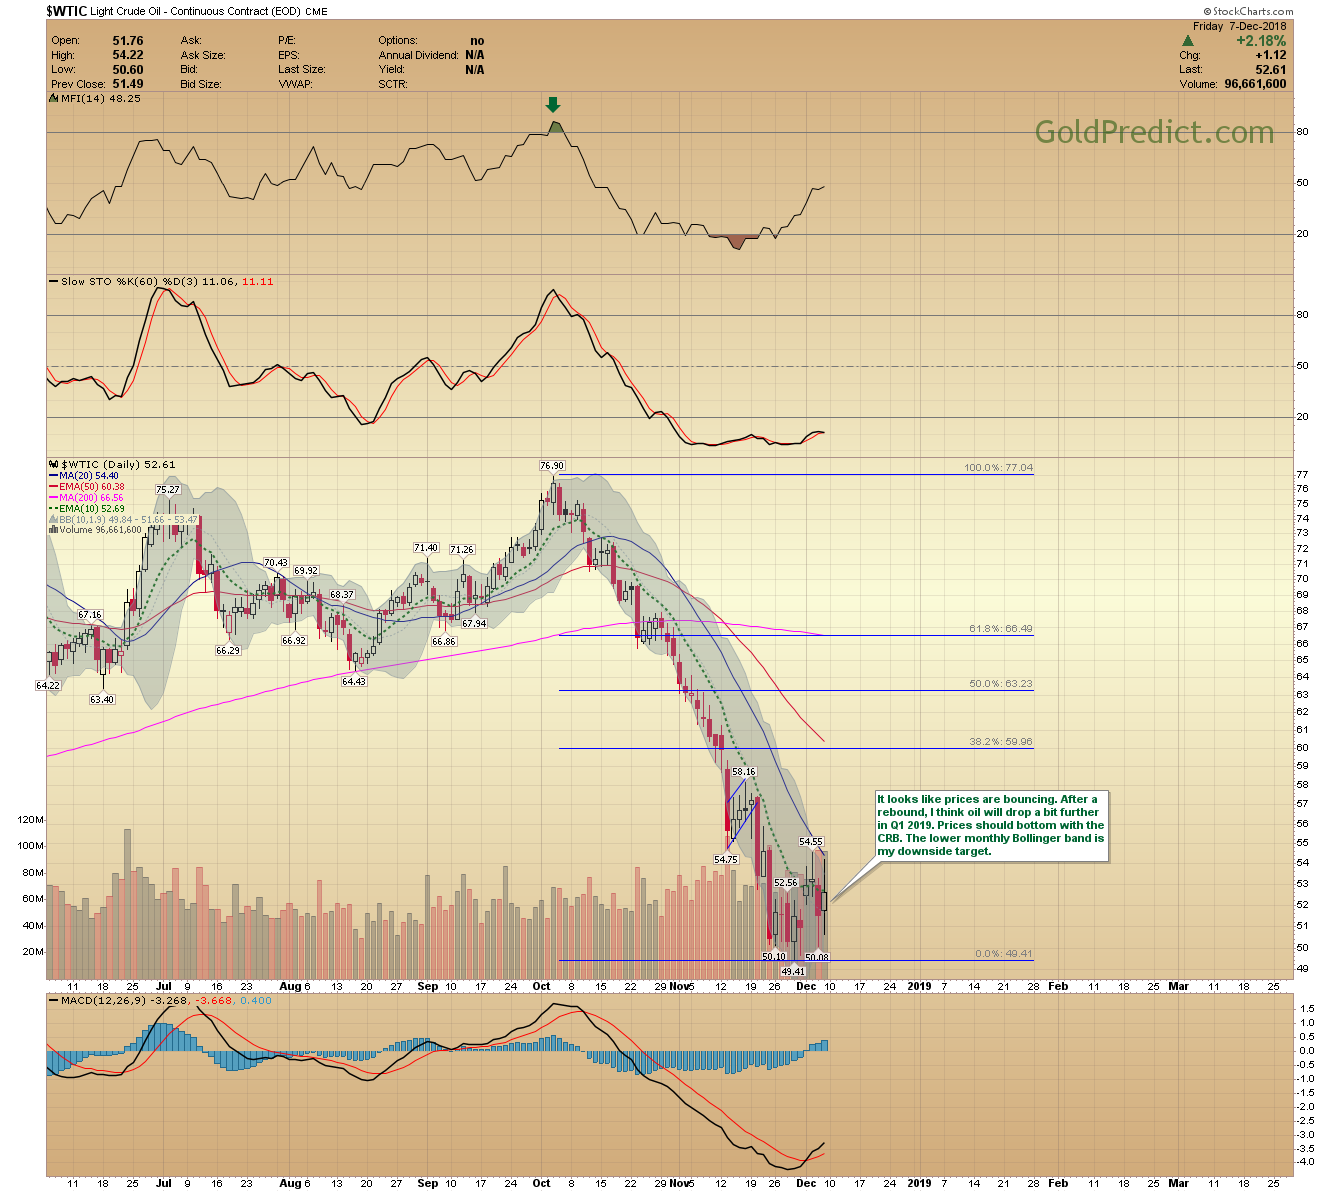
WTIC
It looks like prices are bouncing. After a rebound, I think oil will drop a bit further in Q1 2019. Prices should bottom with the CRB. The lower monthly Bollinger band is my downside target.
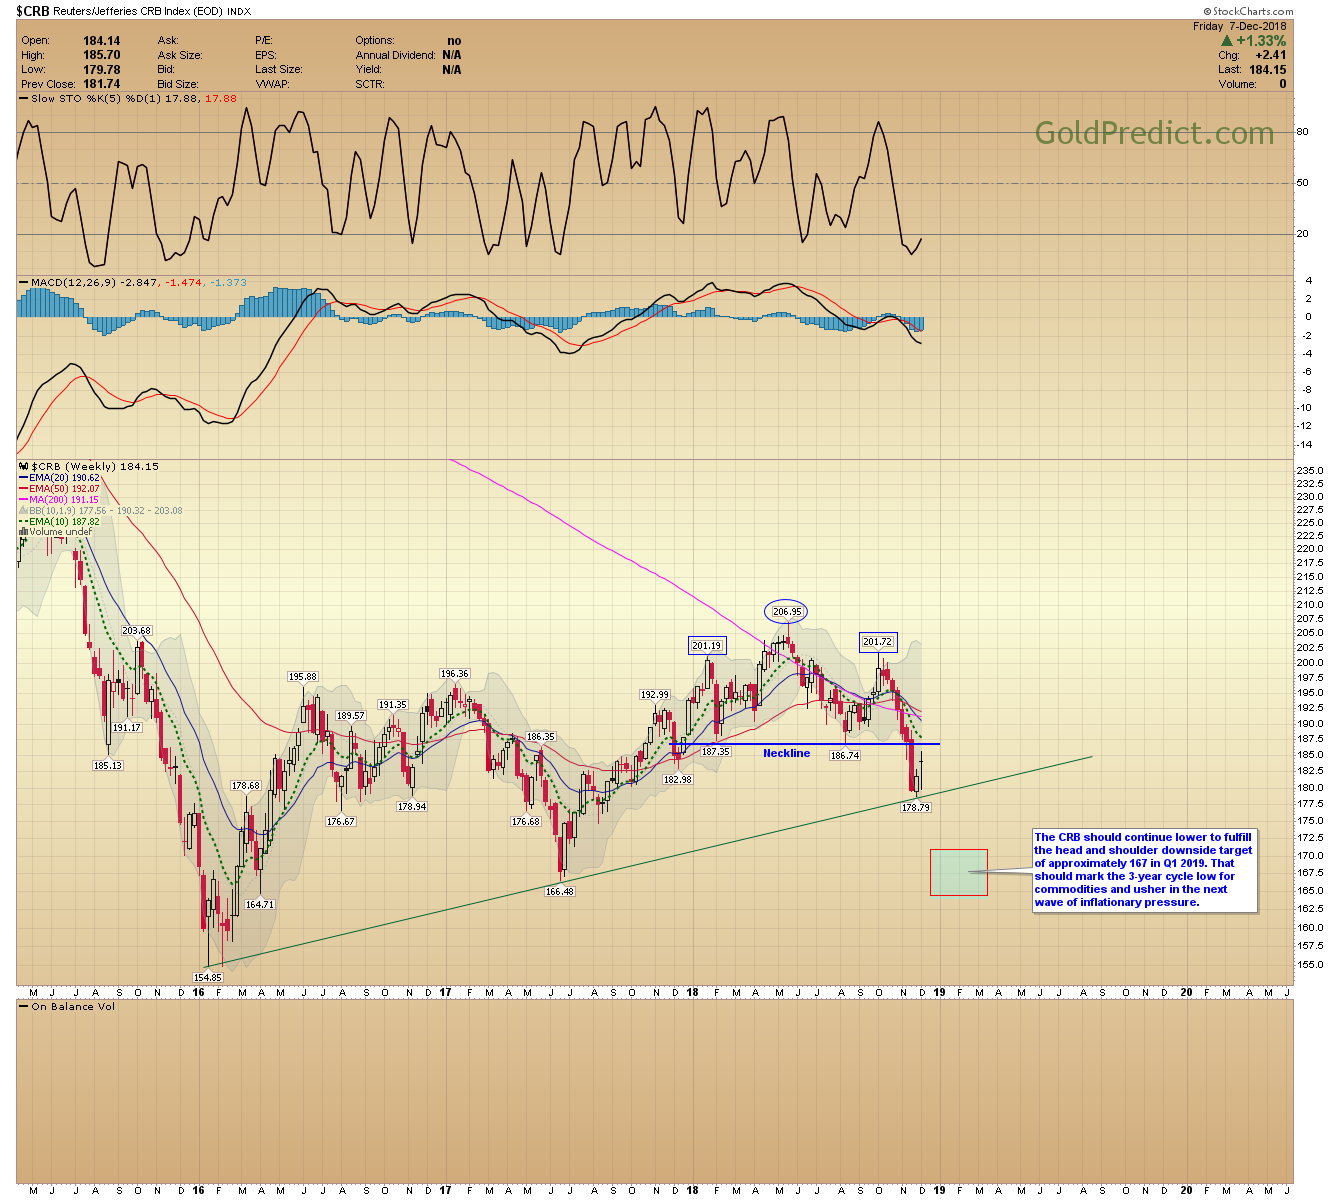
CRB WEEKLY
The CRB should continue lower to fulfill the head and shoulder downside target of approximately 167 in Q1 2019. That should mark the 3-year cycle low for commodities and usher in the next wave of inflationary pressure.
GOLD

HOLD – NEUTRAL
SILVER
HOLD – NEUTRAL
SENIOR MINERS
HOLD – NEUTRAL
JUNIOR MINERS
HOLD – NEUTRAL
Disclosure: None.


