
Gold Bearish ABC Pattern Aiming At $1,700 Support
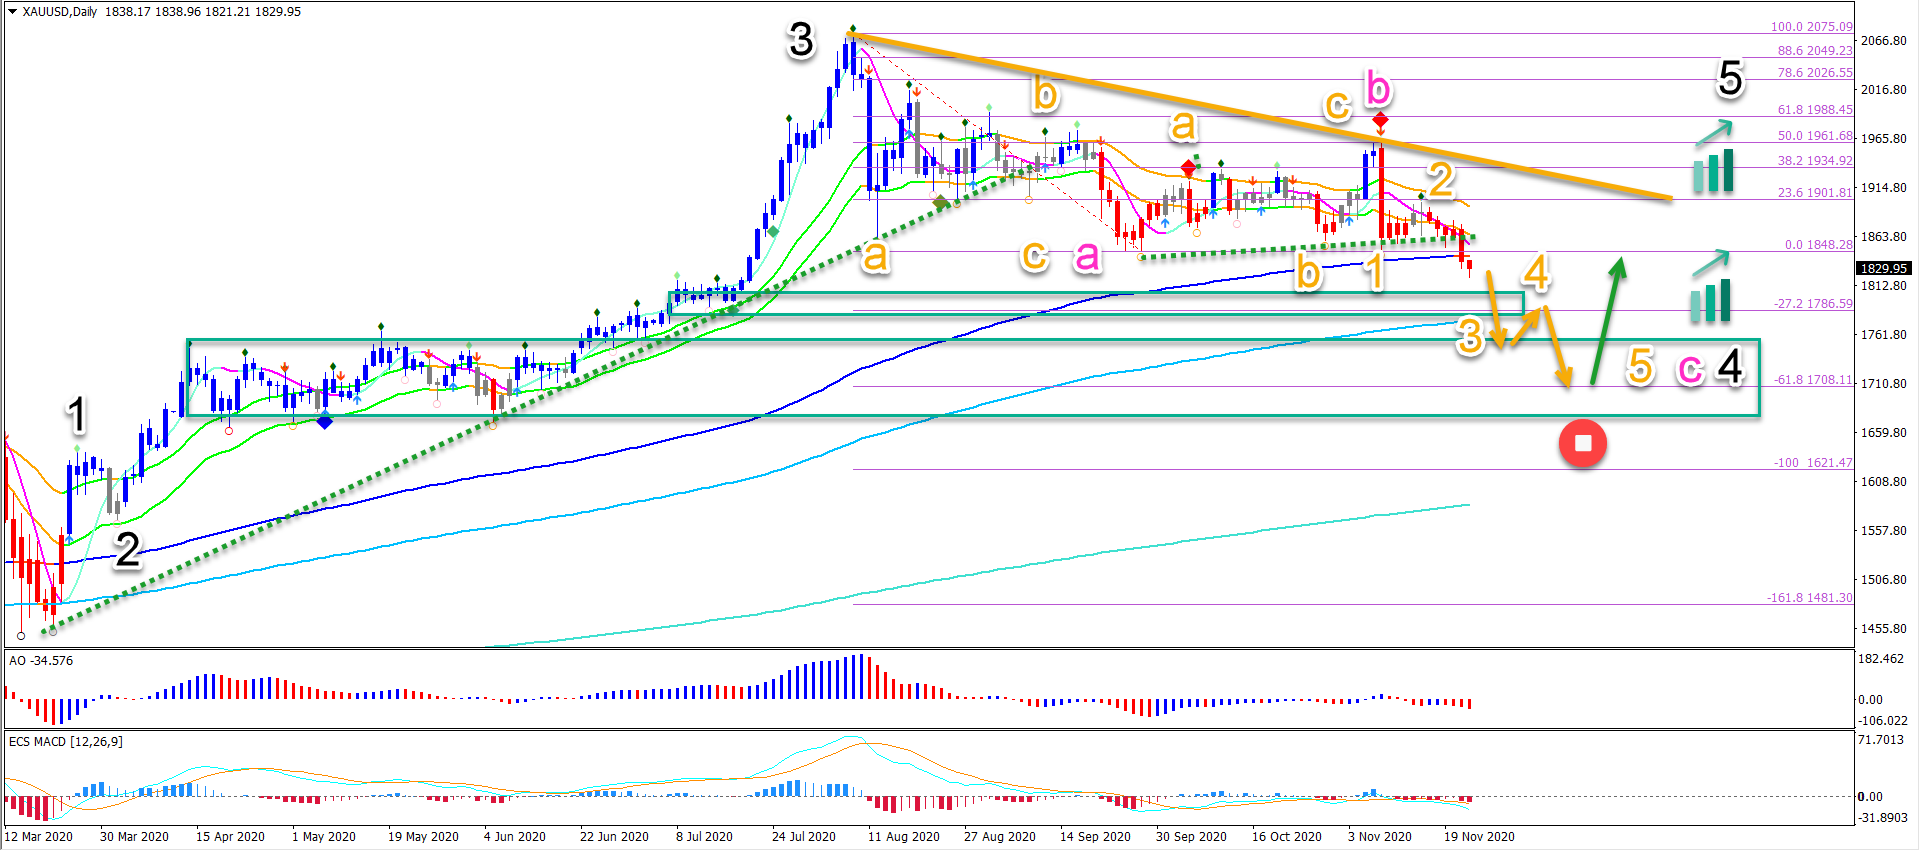
Gold (XAU/USD) is building a bull flag chart pattern (orange lines). Price action seems ready to break below the 21 ema zone. The main targets are the -27.2% and -61.8% Fibonacci targets.
Price Charts and Technical Analysis
(Click on image to enlarge)

The main target of XAU/USD with a bearish break below the 21 ema is the -61.8% Fibonacci. There is also a support zone and previous top (green box) which can stop price action from falling.
A break below the support zone, however, would invalidate the uptrend (red circle). In that case, a reversal is taking place that could take the price much deeper.
On the daily chart, price action seems to be developing an ABC (pink) pattern. A bearish swing via 5 waves (orange) could complete wave C (pink) and potential wave 4 (black).
As long as price respects the -27.2% and -61.8% Fibonacci targets, then an uptrend still remains likely. Only a break below $1700 changes the perspectives and makes a reversal more likely (red circle).
(Click on image to enlarge)
Disclaimer: The opinions in this article are for informational and educational purposes only and should not be construed as a recommendation to buy or sell the stocks mentioned or to solicit ...
more

