
Gold - Almost As Bearish As It Gets
I previously wrote that gold had likely topped even if the USD Index was to decline a bit more. And, well, gold declined regardless of the USD’s small decline. What does this tell us? It says that the medium-term decline in the precious metals sector remains on schedule, and what we witnessed recently was nothing more than a counter-trend pause.
Let’s start today’s journey through charts with the USD Index and a quote from the previous analyses.
I previously commented on the above chart in the following way:
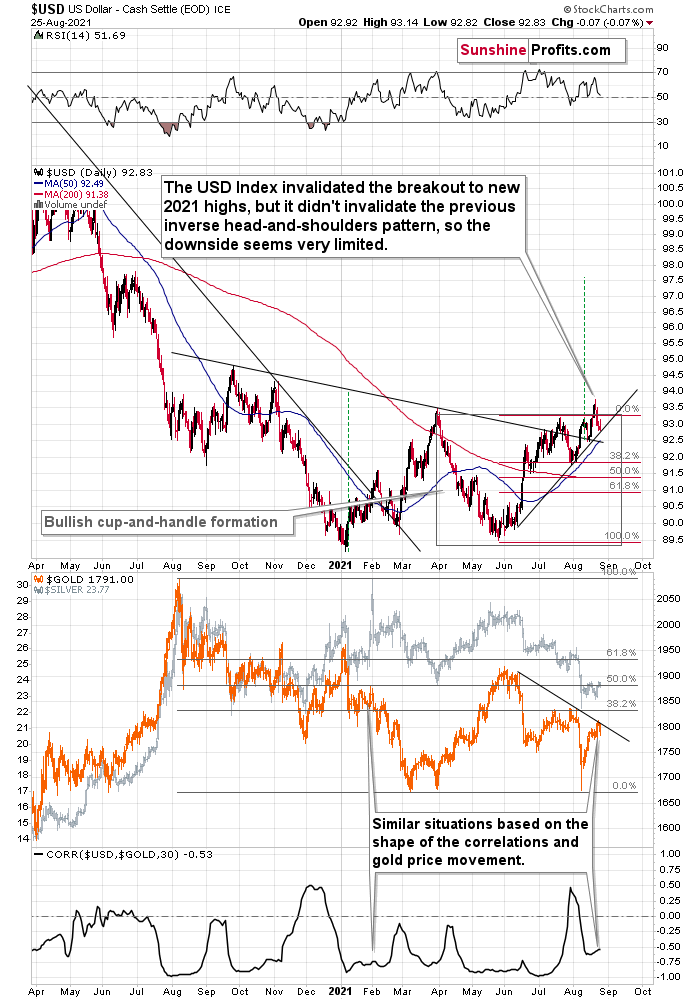
The USD Index invalidated the breakout to new 2021 highs, but it didn't invalidate the previous inverse head-and-shoulders pattern, so the downside seems very limited.
There’s a rising short-term support line based on the June and July lows that currently “says” that the USD Index is unlikely to fall below ~92.75. At the moment of writing these words, the USD Index is trading at about 93.07, so it’s very close to the above-mentioned level.
And even if the USDX declines below it, there’s support at about 92.5 provided by the neck level of the previously confirmed inverse head-and-shoulders pattern. This means that the USDX is unlikely to decline below this level, and this in turn means that the downside seems to be limited to about 0.6 index point. That’s not a lot.
Remember when the USD Index previously invalidated the breakout above the inverse H&S pattern? I wrote then that it could decline to the nearest support level provided – then – by the 38.2% Fibonacci retracement. Now the nearest support is provided by the rising support line at about 92.75.
This doesn’t mean that gold will necessarily rally from here or that the rally will be substantial. On the lower part of the above chart, you can see that gold moved to its declining resistance line, which means that it could decline right away.
The USD Index didn’t move to the above-mentioned rising support line, but it was very close to it. The USD Index has been relatively flat so far today, but gold is already down, so it seems that even if the USD Index bottoms slightly lower, it might not take gold to new short-term highs.
Now I’m Not Doing It!
Based on today’s pre-market trading, it seems that we can view the rising support line as having been reached, and thus we can expect the upswing to continue.
Please note that the USD Index was down yesterday by 0.07, which is not a lot, but enough to make gold rally… if gold wanted to rally, that is.
But gold didn’t really want to rally, so it didn’t. Gold appears to have completed its counter-trend upswing, and it seems that it’s ready for another downswing.
Moreover, gold was down yesterday, and it’s down in today’s pre-market trading as well.
On Tuesday, based on Monday’s rally, I wrote the following:
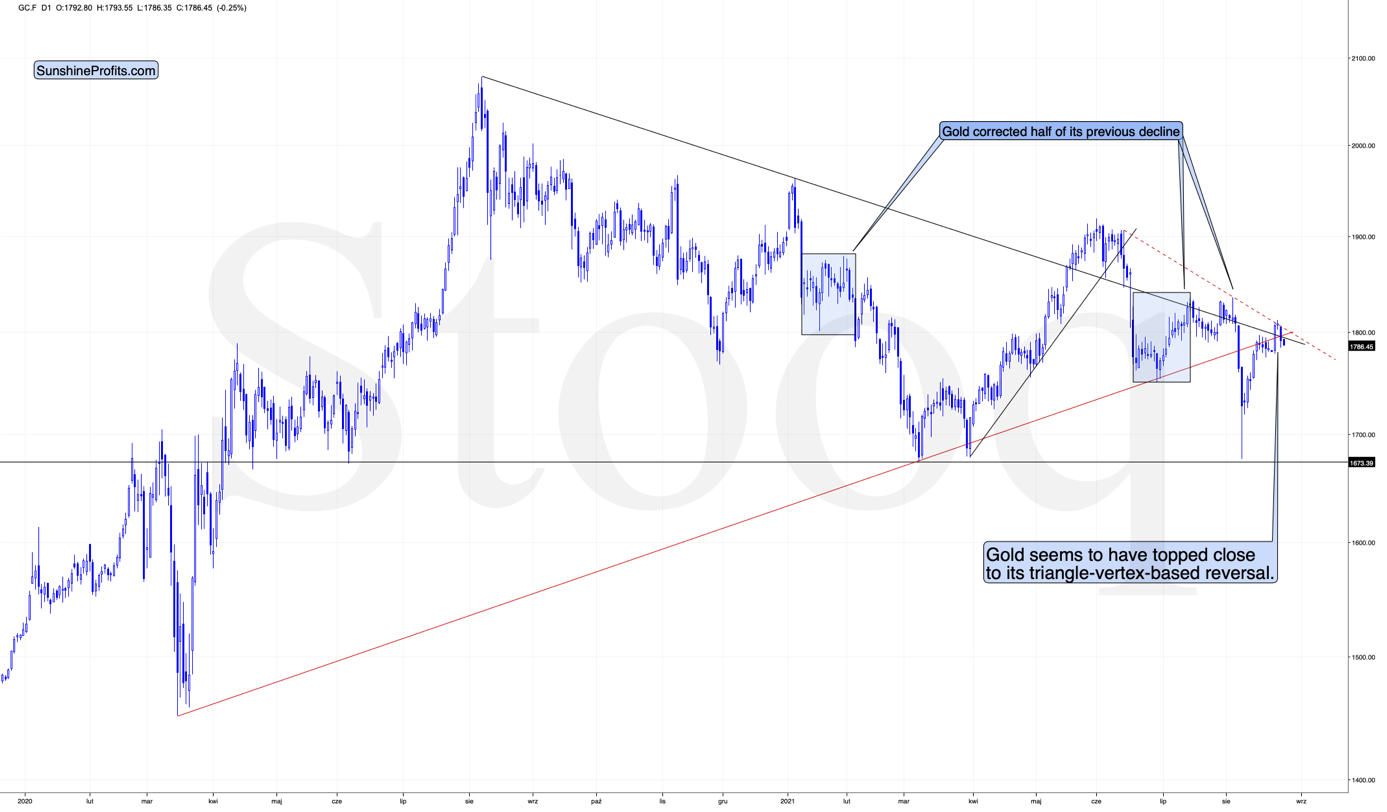
The combination of the resistance line being reached with the fact that gold did that right on its reversal day indicated by the triangle’s vertex makes it even more likely that gold will reverse its course shortly.
We can see the same thing – gold moving to its resistance line – also when we look at its performance through its most popular proxy – the GLD ETF.
In this case, we can compare where gold rallied to where the mining stocks (the GDX ETF) rallied. And while the GLD moved to its declining resistance line, the GDX ETF was not even close to its analogous dashed declining resistance line.
Instead, the GDX ETF moved back to its previously broken neckline of the head and shoulders pattern and closed slightly below it.
This is more important than comparing the GDX’s closing price to its previous yearly low — it closed slightly above it.
Here’s the chart I described above:
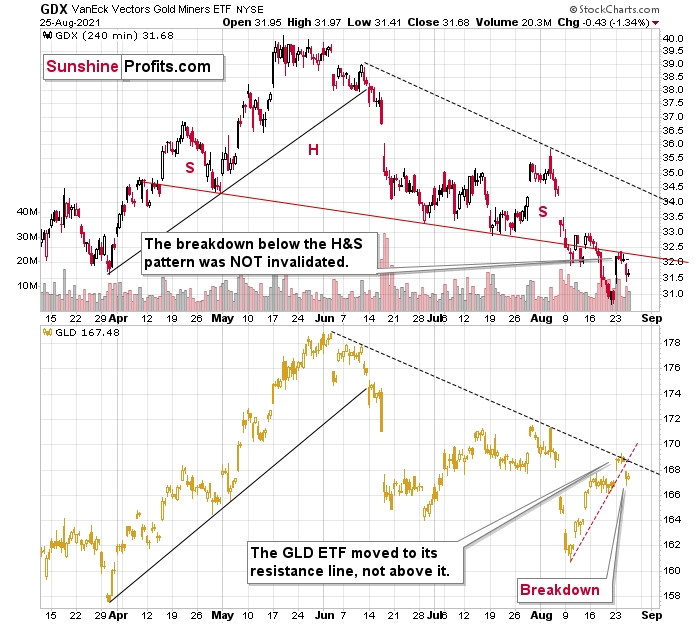
As you can see, that’s more or less what happened. Gold reversed course at the turning point and the declining resistance line, while mining stocks simply verified the breakdown below their April – August head and shoulders pattern. What’s more, the GLD ETF already broke below its rising red support line. That’s almost as bearish as it gets. Almost, because the breakdown in gold is not yet confirmed. Still, since gold underperformed the USDX in the last few days, it seems that the breakdown is valid.
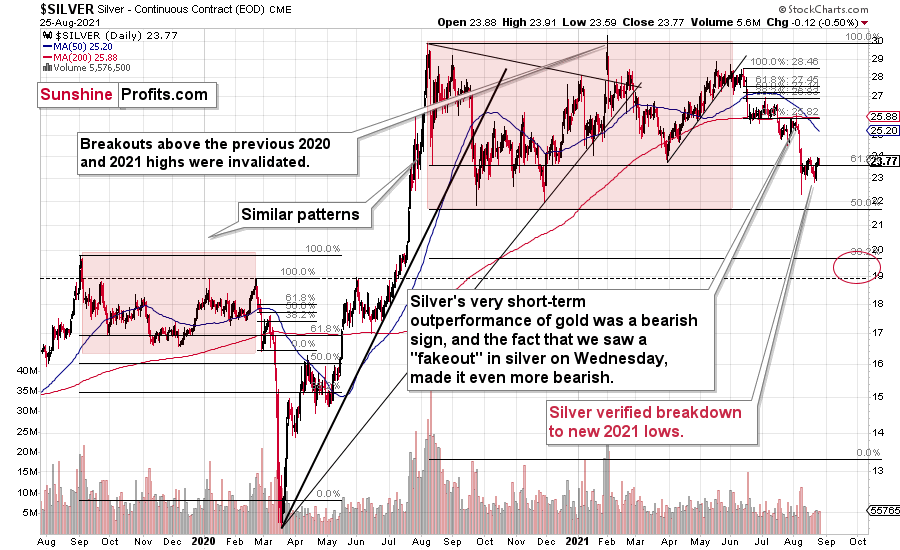
Silver moved a bit lower recently, but it’s still relatively close to its most recent short-term high. It didn’t invalidate the breakdown below its previous 2021 lows, but I would like to warn you that silver might attempt to stage a fake breakout before sliding. We saw this kind of performance in early August, and we can (but don’t have to) see it once again. So, if silver rallies here while gold and miners don’t, it will most likely not be a bullish signal but rather a bearish confirmation.
All in all, it seems that the precious metals sector is ready for another sizable decline.
Disclaimer: All essays, research and information found on the Website represent the analyses and opinions of Mr. Radomski and Sunshine Profits' associates only. As such, it may prove wrong ...
more

