
Gold: $1,800 Handle Coming Up
On June 7, 2020, I published an article on Seeking Alpha called “Gold: Time to Load up the Truck Again.” Gold was at $1,688.60. We identified the levels that were indicating the possibility of a major area of support or buy area. I wrote, “We have come down to the Buy 2 daily level of $1,688 and the weekly Buy 2 level of $1,681. $1,682 is the last. We are getting a weekly signal activated at $1,681. The artificial intelligence prepared us for the market moving into the upper zone of $1,740, which was an area of distribution. Ever since the market made the high of $1,788, we have been in a consolidation period. From the April 13 high of $1,788 to now, we are at the extreme below that mean.”
When we wrote the report, the average daily price on Friday was $1,718. The Sell 1 target was $1,737, while $1,748 was the Sell 2 level. The Buy 1 is $1,707 and the Buy 2 is $1,688 for today.
We make an effort to explain the methodology of the Variable Changing Price Momentum Indicator (VC PMI) algorithm: “By coming down to the daily extreme level below the mean, it connects the daily of Buy 2 of $1,688 with the weekly number of $1,681. We have been expecting this reversion to the mean because that is what we trade.”
The VC PMI is an algorithm written in C++ easy language and is automated in TradeStation. The algorithm can be used by daily, swing and position traders. Here we share the weekly and monthly targets, since the daily targets change daily and we can’t publish reports in time for the daily triggers. The information changes dramatically daily. This is a methodology that you can apply systematically, mathematically and unemotionally to structure your trading with very high probabilities.
(Click on image to enlarge)
Fundamentals
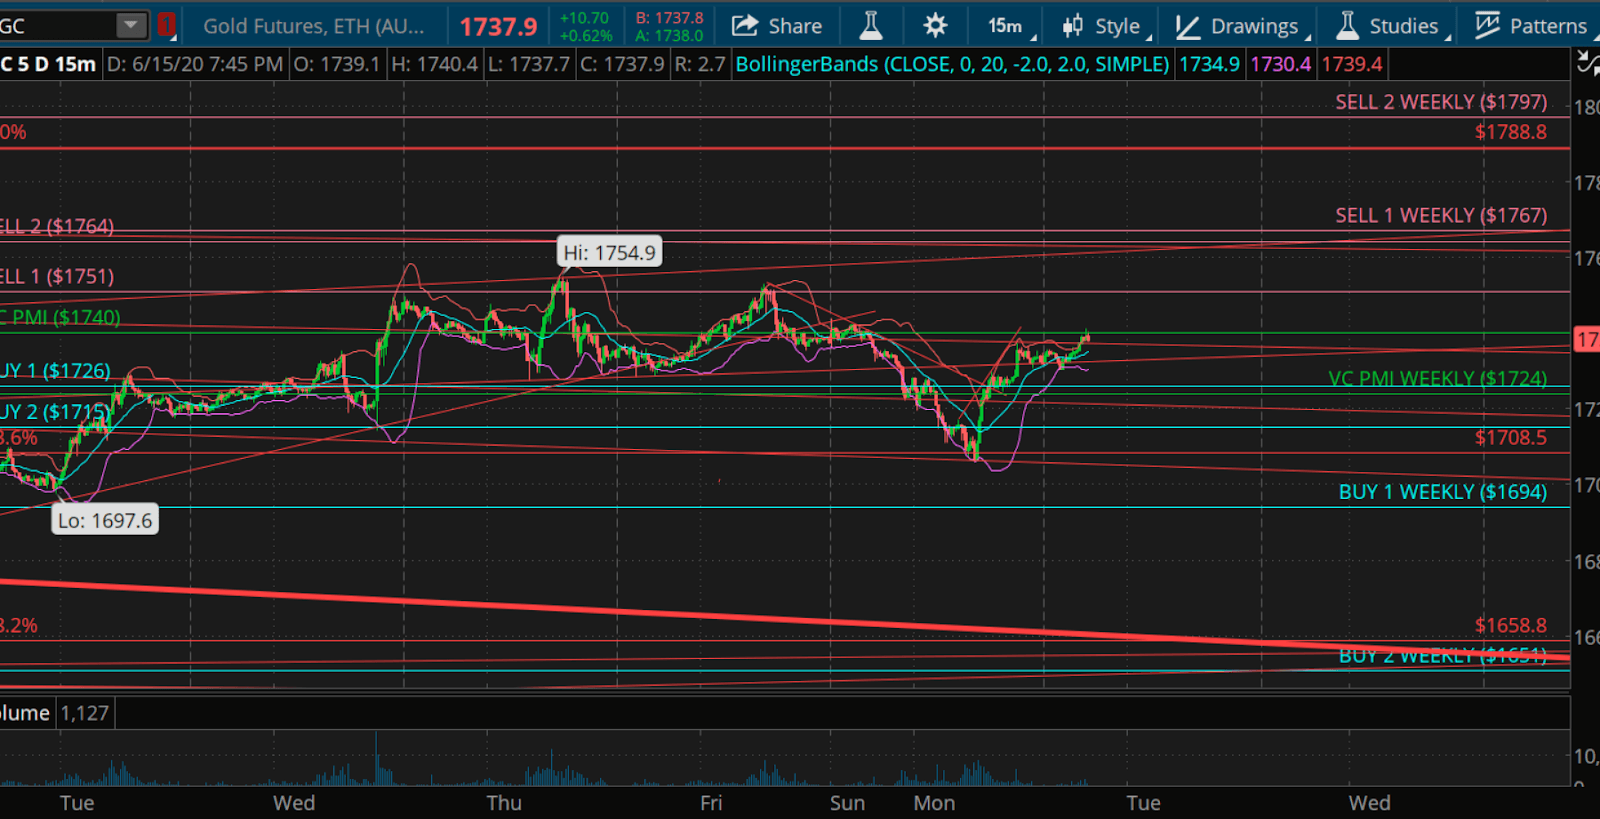
If we look at the fundamentals that have developed since June 7, the market validated the expectation of the VC PMI as the area of resistance or distribution of supply that we identified at $1,754.90, made on June 11, it was a short-term swing counter-trend that activated the extreme levels below the weekly average of $1,724.
(Click on image to enlarge)

Courtesy: TD Ameritrade
This comes on the face of some dire economic news and the continuation of the Federal Reserve statements that they will continue to apply unlimited stimulus to stabilize the markets and the economy, with another stimulus package under discussion with the objective of applying the stimulus to Main Street or the private sector. The first bout was in 2008 and was designed to handle the panic that the markets would collapse. The credit markets basically shut down. We had a credit squeeze that created the panic that evolved into the collapse of the mortgage industry that was highly leveraged at the time. It was one of the catalysts that broke the system in 2008. Now, with the COVID-19 pandemic, which is now blamed for the broken system we have experienced over the past couple of months, we are facing the need for even greater stimulus packages.
(Click on image to enlarge)
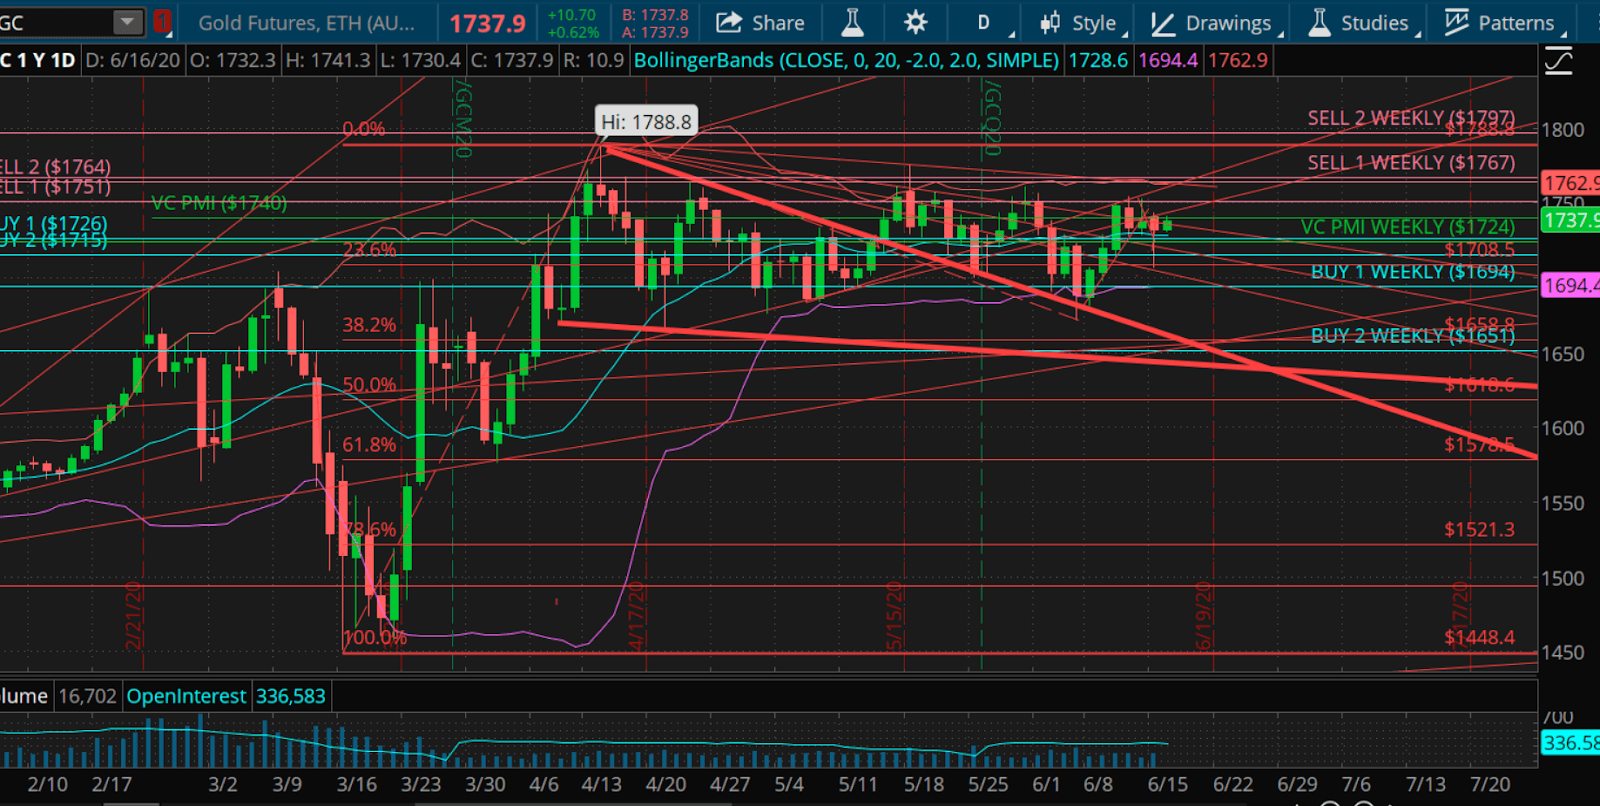
Contrary to the general consensus that the price of gold should explode, it has sat around $1,788 and entered a consolidation phase that lasted until recently when the market came down to this level of the weekly Buy signal of $1,694, when we saw the reversion occur, validating that buyers were showing up at this level. We rallied from there to $1,754.90, so we are getting $50 and $60 moves as commonly as previous $10 moves. Now we are in uncharted waters. We have come down to levels of what artificial intelligence calls accumulation of demand. As we come into this week, the AI identified the average weekly price at $1,724 and the buy one is $1,694 and gives us a level all the way down to $1,651, which is the Buy 2 level for the weekly. When we published this data, it does not mean that these numbers have to be completed. Once we have the data, we overlay it with the daily data and use the daily and weekly data to identify the highest probability relationships between the daily, weekly and monthly data.
The market came down to this level which identified the market low to be $1,709.40, not quite coming down to the Buy 1 level of $1,694, and we found buyers. At 5:22 pm today, the daily average was $1,740. The Buy levels were at $1,726 to $1,715 on the daily. I will include a link to the trade we made based on this information, which was verified by Ticker Tocker.
As the market came into this level of $1,715 daily and went above the weekly average price of $1,724, it also brought in the daily trigger of $1,726, giving us a very high probability that when the signal was activated at 8 a.m. this morning, we were going to activate not only a daily buy signal, but also a bullish price momentum. The market trading last week at the $1,750 level was actually a bull trap. The artificial intelligence said that the area of $1,750 is an area of distribution where sellers would come into the market, which is exactly what happened. The market came down into that daily average price. Once the support is broken, it becomes resistance. The signal completes the pattern of the extreme below the mean, which is the daily and weekly buy levels. It activated a bullish price momentum with the target of $1,767 for the rest of this week.
Regardless of the sentiment of the market, the price of gold is following its technical and seasonal foundation, not its speculative sentiment, which we have been trading since the high in April. Regardless of any predatory selling that has come on the highs, we have been able to see some major buying coming into the market, which is limiting the predatory short selling. Such selling uses unlimited amounts of paper supply, which has in the past skewed the real price of gold in relation to the US dollar, the debt and interest rates. Since 2013, gold has been skewed from its real value or mean. The only thing I see online is a lot of speculation in terms of where prices could go up to some ridiculous numbers, which are unrealistic. The fundamental situation in relation to the stimulus is going to have long-term consequences. The issue that the Fed is focused on is to stop the bleeding and stop this crisis from worsening and threatening the global economy. Based on the feedback from this, we should start to see some equilibrium come back into the market fundamentally. But for now, the market is trading based on the technicals, not the fundamentals. We continue to see record levels of buying in gold, with more than 40,000 buyers taking delivery of physical gold in the COMEX market recently. As a trader, you have to be aware that we are dealing with a different benchmark in volatility, so you need to be more active than you might like to be. There can be $200 or even $300 corrections, even as the secular bull market continues with the target in 2020 of $1,803.
Disclosure: I am/we are long GDX.


