
Fed Preview: US Dollar, Dow & Gold Performance On FOMC Decision Days
The Federal Reserve is on deck to release its January 2020 FOMC interest rate decision today at 19:00 GMT. Details provided by the US central bank will likely be examined closely by market participants for clues on changes in language communicated by Fed officials regarding their relative hawkish or dovish leaning.
Traders are overwhelmingly expecting the Fed to leave its policy interest rate – the Federal Funds rate (FFR) – unchanged at a target range of 1.50-1.75%. As such, focus could be placed predominantly on forward guidance found in the FOMC press statement as well as follow-up commentary from Fed Chair Jerome Powell on recent balance sheet growth via repo operations.
Considering the material impact that changes in FOMC outlook typically has on market price action, it is important to take note of how US Dollar (DXY Index), Dow Jones Industrial Average (DJIA) and Gold (XAU/USD) have historically performed in response to Fed interest rate decisions.
HOW FOMC INTEREST RATE DECISIONS IMPACT MARKET PERFORMANCE – US DOLLAR, DOW & GOLD
(Click on image to enlarge)
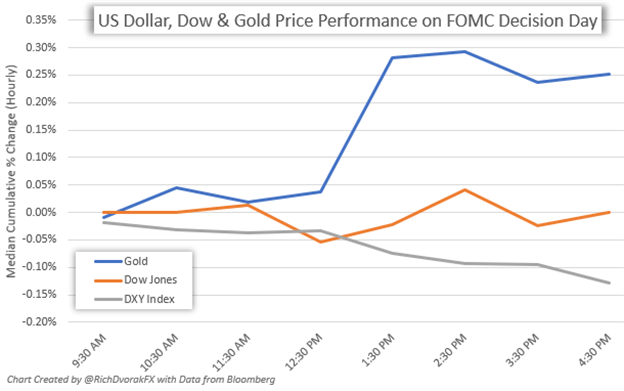
Isolating price action in the US Dollar, Dow and Gold on FOMC decision days since 2015, it becomes evident that volatility tends to rise on balance in the run-up and aftermath of when the Fed press statement crosses the wires at 2:00 PM EST.
Also noteworthy is how Gold prices, on balance, have responded positively in response to FOMC interest rate decisions while the direction of the US Dollar has tended to drift lower. At the same time, the Dow Jones generally trades mixed and fluctuates considerably.
DXY INDEX – US DOLLAR PERFORMANCE & FED MEETINGS
(Click on image to enlarge)
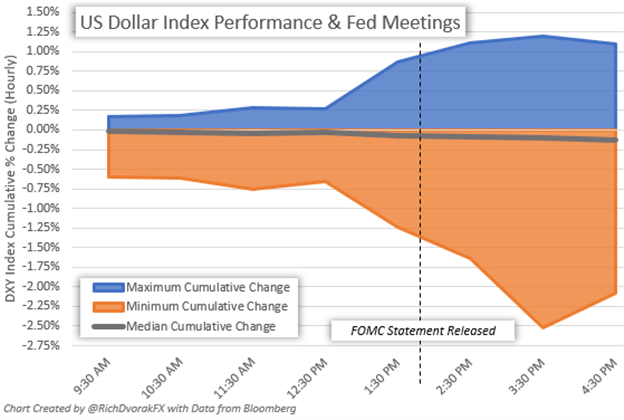
The largest bullish change in the US Dollar Index on FOMC decision days is 1.20% while the largest bearish change is -2.52% according to hourly data pulled over the last 5-years.
DJIA – DOW JONES INDUSTRIAL AVERAGE PERFORMANCE & FED MEETINGS
(Click on image to enlarge)
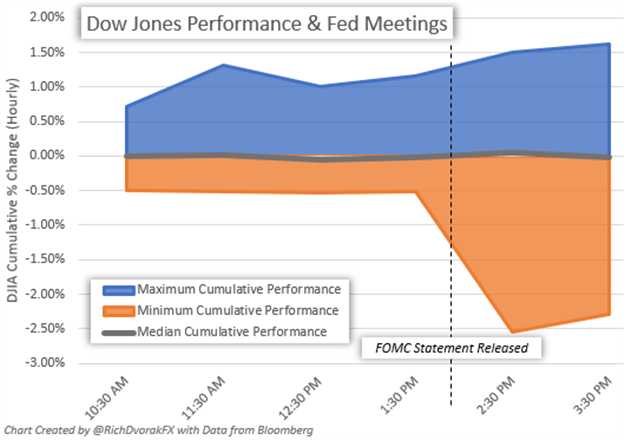
The largest bullish change in the Dow on FOMC decision days is 1.51% while the largest bearish change is -2.54% according to hourly data pulled over the last 5-years.
XAU/USD – GOLD PRICE PERFORMANCE & FED MEETINGS
(Click on image to enlarge)
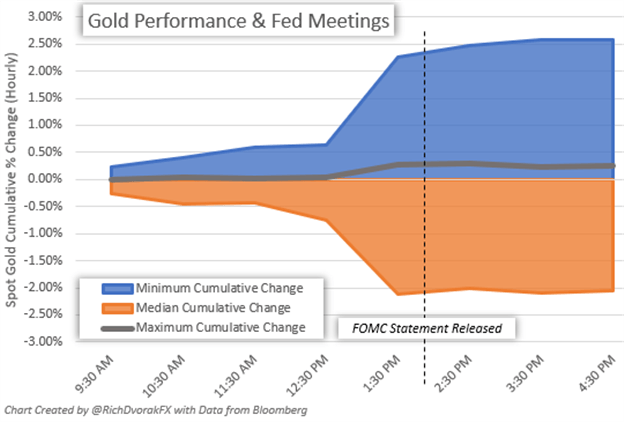
The largest bullish change in spot gold on FOMC decision days is 2.59% while the largest bearish change is -2.11% according to hourly data pulled over the last 5-years.


