
Fed Appointment, Rate Hike Expectations & Strong USD Weigh On Gold
Fundamentals Weigh On Gold Despite Inflation Concerns
The precious metal (GLD) has been on the wrong side of a large move in recent days as it struggles to halt mass selling which began on November 22, after it was confirmed that the more ‘hawkish’ of the two main candidates, Jerome Powell, would serve another term as Chairman of the Federal Reserve Bank.

While Powell is far from hawkish and has actually proven to be one of the most dovish Chairman in recent decades, he was viewed by the market as being less dovish than fellow candidate, Lael Brainard. As such, a renewed expectation of interest rate hikes showed up in the treasury markets with the 2, 5 and 10 year rates accelerating past prior highs.
US Treasury Yields (2,5,10 and 30 year yields)
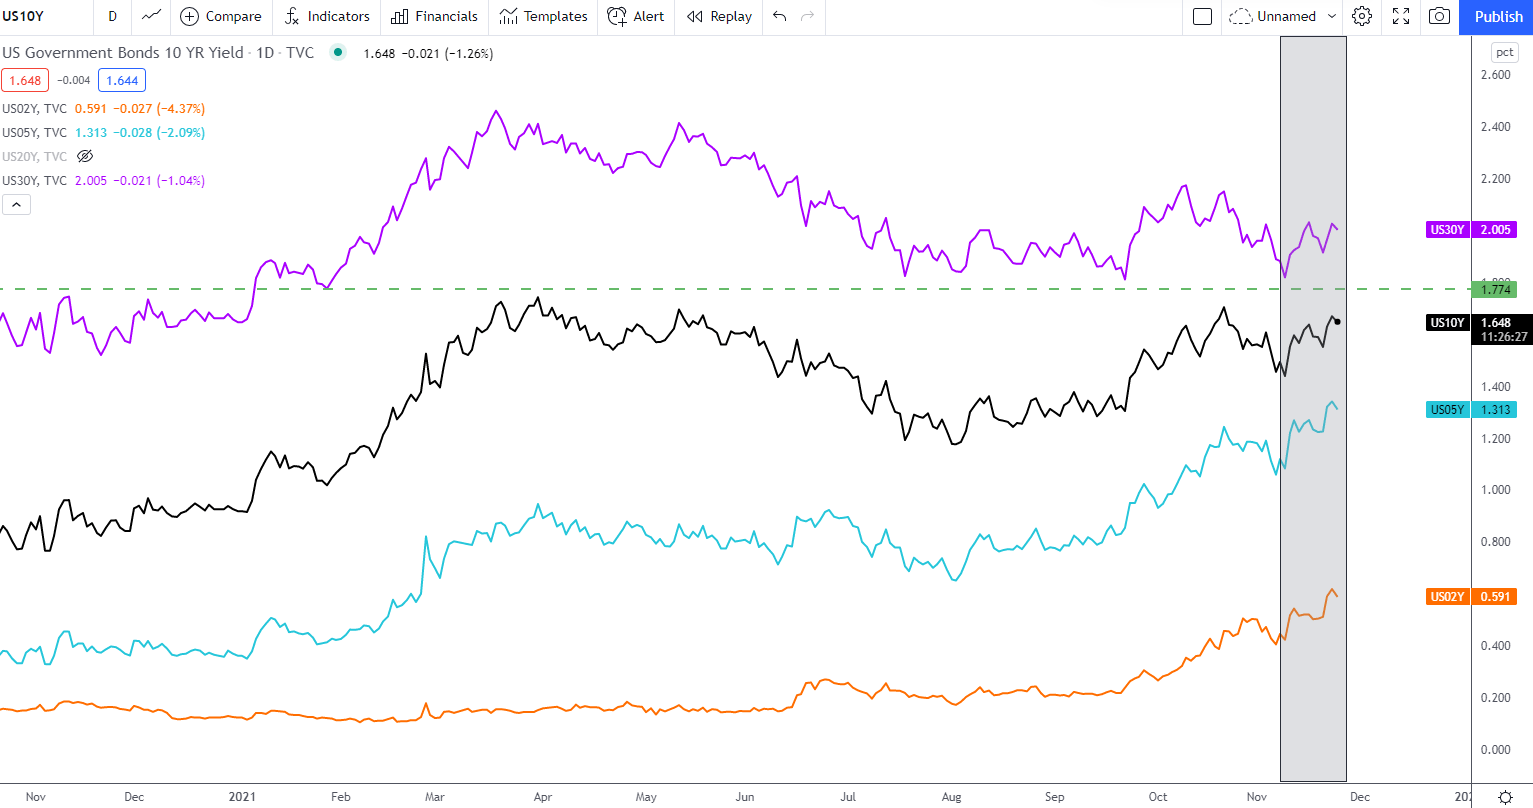
Chart prepared by Richard Snow, Tradingview
Additionally, the US dollar continues to surge higher although it usually receives a lift when treasuries rise however, the dollar has been looking strong ever since breaking above the 95 handle on the US Dollar Index (DXY). The index serves as a gauge of dollar performance as it is weighed up against a handful of major currency pairs with the Euro carrying the highest weighting (FXE, UUP).
Below is a chart highlighting the recent inverse relationship between gold and the US Treasury 10 Year yield:
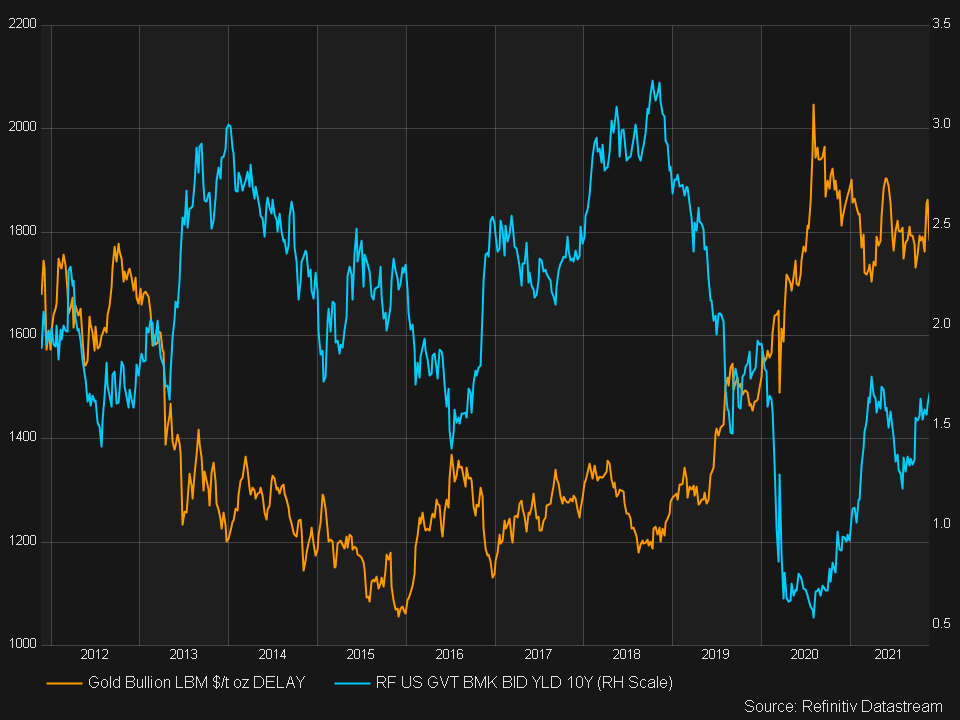
Chart prepared by Richard Snow, Refinitiv
CBOE Gold Volatility Index (GVZ) has moved higher but was already elevated in the lead up to the Fed announcement where it may remain for the rest of the US session considering the high market impact event risk scheduled later today.
CBOE Gold Volatility Index
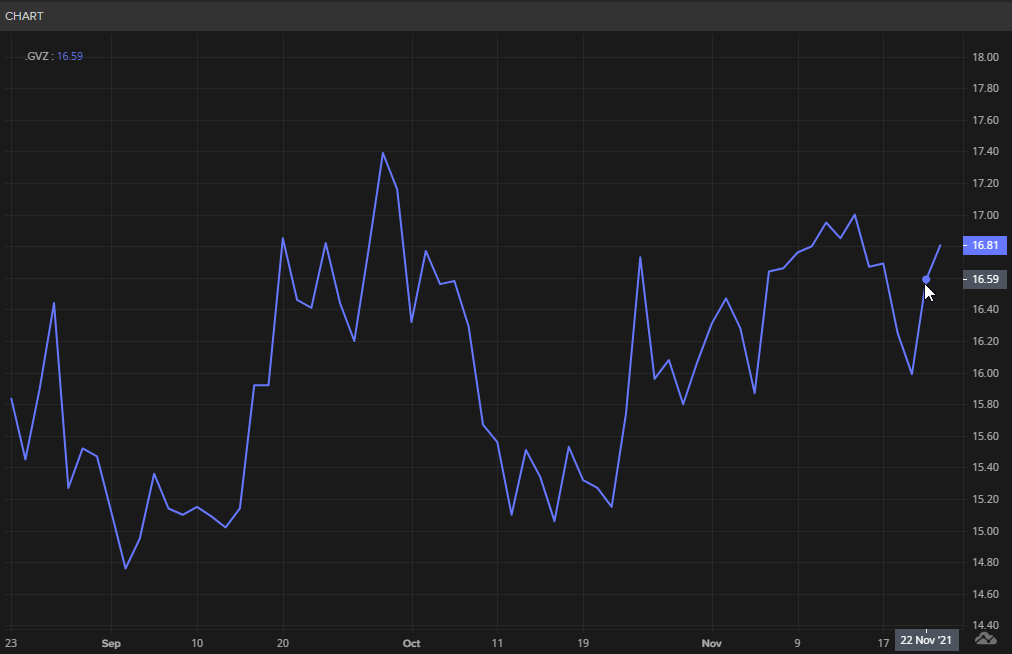
Chart prepared by Richard Snow, Refinitiv
Keep an eye on core PCE data out later today (4.1% YoY Oct - expected) as this may have an indirect effect on the precious metal via the treasury market. Then, much later, the FOMC minutes of the November meeting is made available for further insight into the decision to begin tapering Fed asset purchases.
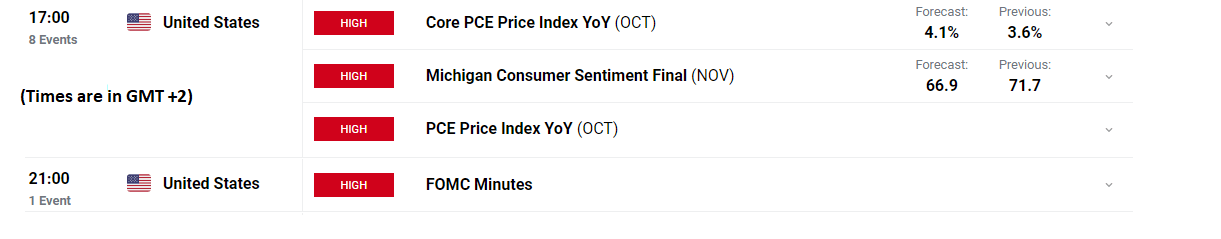
For all market-moving data releases and events see the DailyFX Economic Calendar
Gold Technical Analysis And Key Levels
The daily chart shows a clean and aggressive break below the 1835 mark and the 38.2% Fib level (1823) - taken from the 2020 to 2021 major move - before somewhat settling below the 1800 psychological level just above trendline support. The ascending trendline acting as support remains the nearest challenge to a bearish continuation and currently props the market up. A break below would see the crucial zone of support (1754- 1764) shift into focus.
On the other hand, gold bulls may be looking for an indication of an overreaction and may look for a close and hold above 1800 however, due to the size of the recent move and in an attempt to avoid a sideways trading market (between 1764 and 1835), it would be more prudent to wait for another move above 1835 to reignite a bullish narrative.
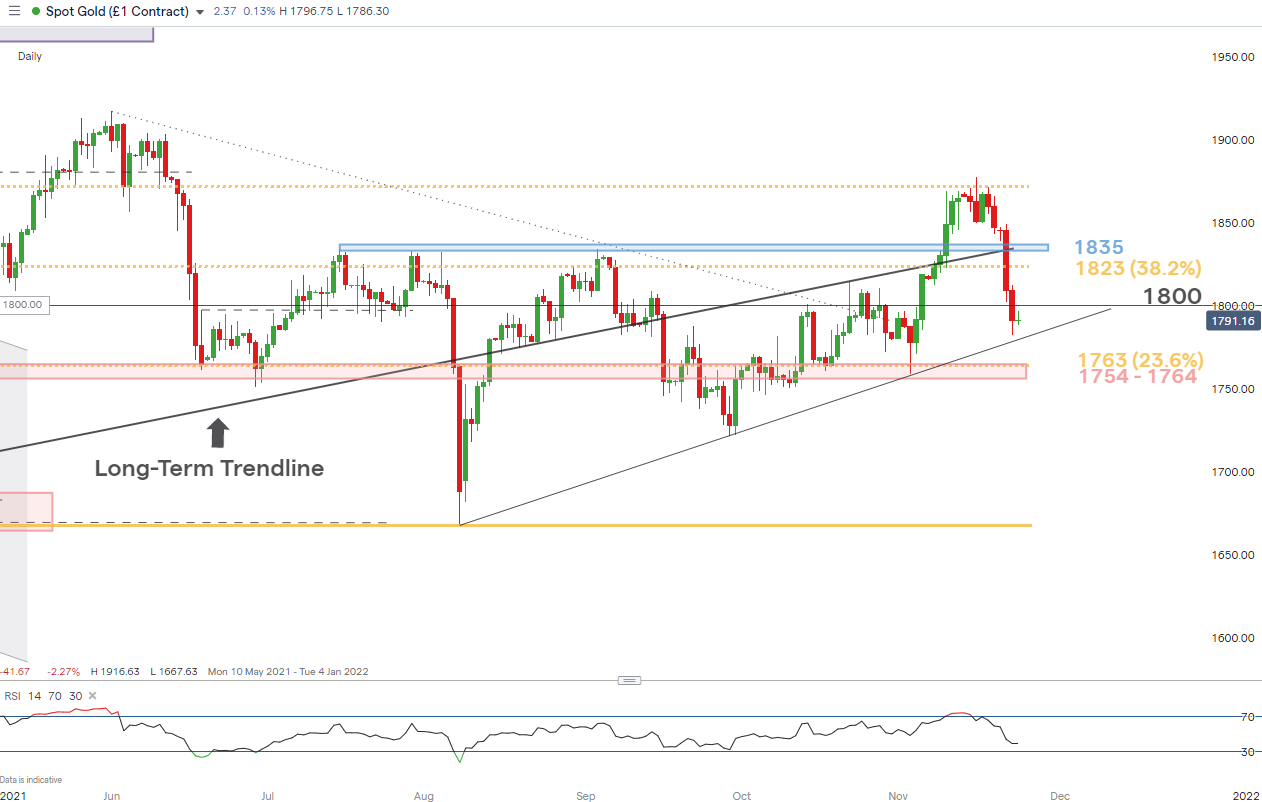
Chart prepared by Richard Snow, IG
Disclaimer: See the full disclosure for DailyFX here.


