Fear Indicators Creating Huge Bearish Reversal Patterns This Month?
Its been a rough month for Stocks and Crude Oil. Could these two indicators be suggesting that panic in fear has run out of steam?
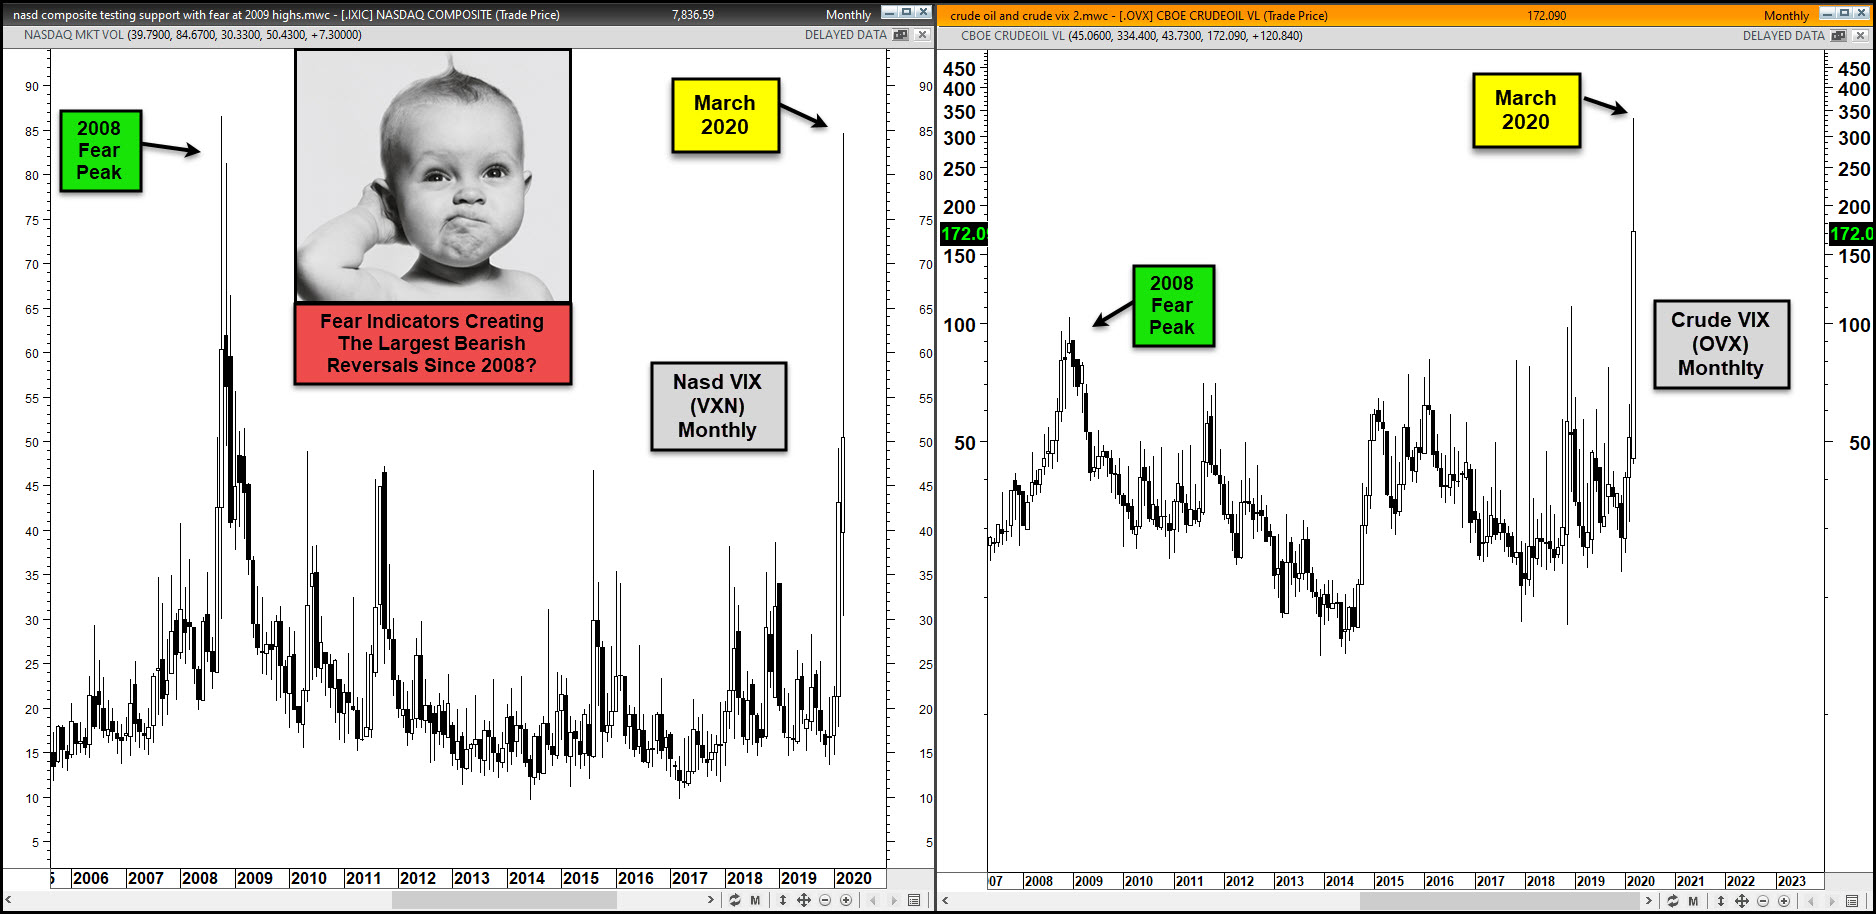
This 2-pack looks at the fear indicators in the Nasdaq (VXN) and Crude Oil (OVX).
Both were at the highest levels in years back in 2008. Both peaked in 2008, as they created monthly bearish reversal patterns.
Turing the page to March of 2020, the Nasdaq fear index could be double topping at the 2008 highs and the Crude Oil fear index is hitting the highest level in history.
While hitting these lofty level, as the month is coming to a close, both look to be creating the largest bears reversal patterns in the past 13-years, at the same time!
If these patterns are sending us a correct signal, both of them are suggesting both have created short-term highs this month.
(Click on image to enlarge)