
Factoring Equities Into Gold’s Equation
Something is astir in the equities markets. With retail activity at unprecedented levels, record call option volume, and speculative stock buying at a breakneck pace, once the house of cards tumbles down, what happens to gold or the miners?
Before examining equities though, let’s take a brief look at a potential rebound in the precious metals, which might seem like a danger at first, but actually isn’t.
We might see a relatively small corrective upswing in the precious metals sector, but it doesn’t seem certain enough for us to adjust the current (profitable) trading position.
After showing exceptional weakness relative to both gold and the stock market, miners have finally found some very short-term support that could trigger a small rebound. The emphasis is placed on “small”, and on “could”. If the above sentence included the word “temporary” it would get the emphasis as well.
Here’s what happened:
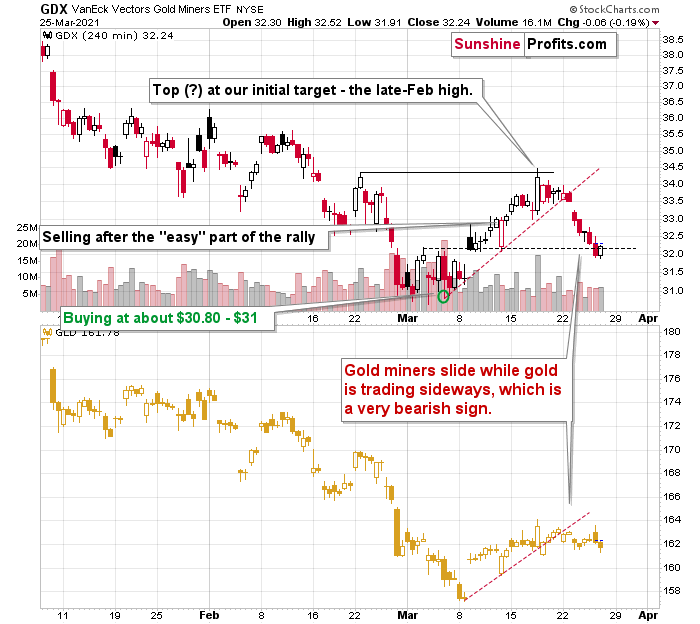
After breaking below the rising red support line and declining quite visibly despite gold’s back-and-forth trading, miners finally reached a support level that could trigger something other than more declines.
I marked this support level with black, dashed line. It’s based on the early-March high, the price gap that we saw shortly thereafter, and on the March 12 intraday low. A triple support level might seem like a very big deal, but let’s keep in mind that all these support levels are of very short-term nature. Consequently, if they are going to trigger a rebound, it’s likely to be of very short-term nature as well.
Having said that, let’s take a look at the market from a more fundamental angle.
Piecing Together the Bearish Puzzle
With the PMs eliciting weakness in the face of a rising USD Index, I wrote previously that if a crisis of confidence erupts across U.S. equities, the PMs could move substantially lower. When combining an equity shock with a USD Index resurgence, the yellow metal could bottom at roughly $1,400 (or even ~$1,350).
And despite a late-afternoon rally helping to save face on Mar. 25, U.S. equities have displayed heightened volatility over the last week. With stimulus checks already in the price and the whipsawed trade eating away at options’ Theta (time value until expiration), retail traders could soon run out of funds.
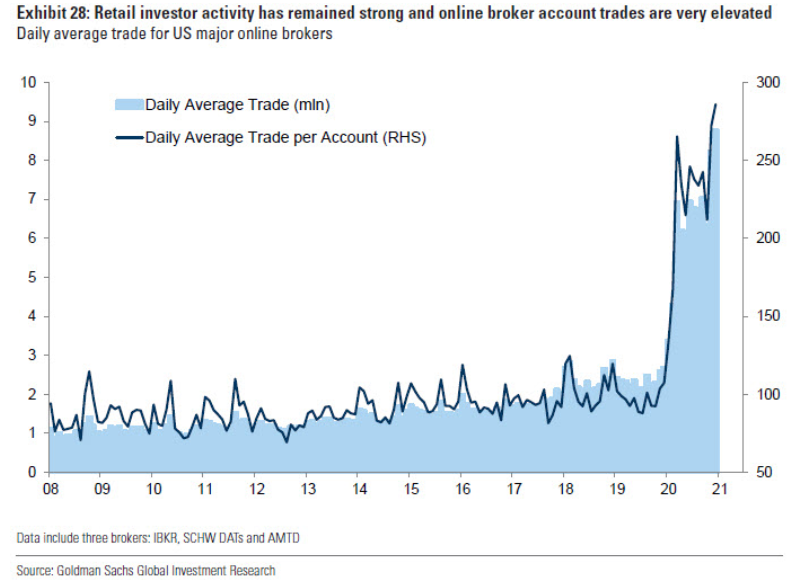
If you analyze the right side of the chart below, you can see that retail participation is unlike anything that we’ve seen over the last ~12 years.
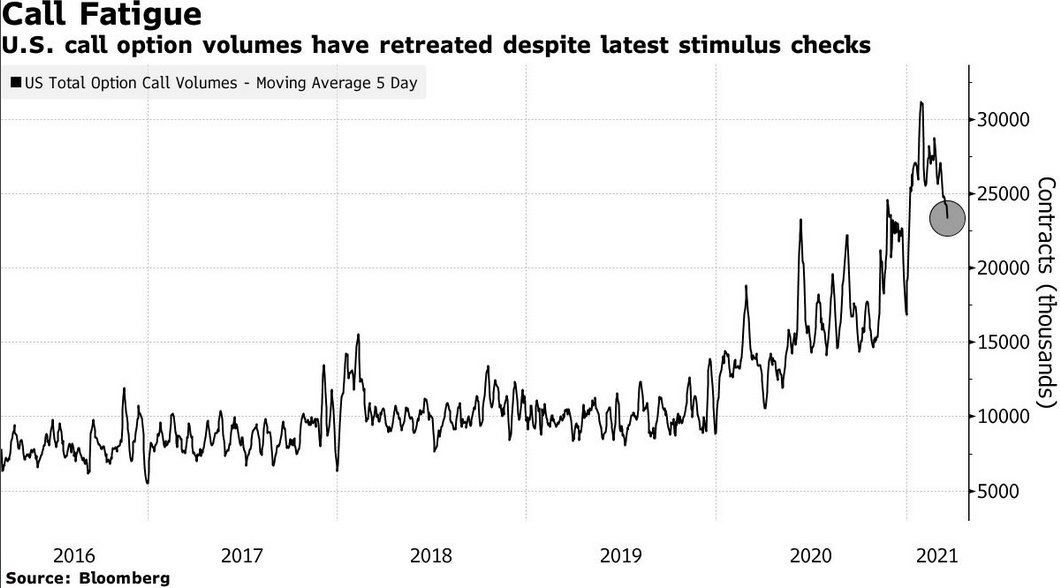
However, with their rallying cries heard loud and clear in the options market, the parabolic rise in retail activity has also coincided with record call option volume. But, as the up-and-down trade causes more and more option contracts to expire worthless, retails’ derivative demand is slowly dissipating.
Please see below:
To explain the significance: Option values are determined by ‘The Greeks’ – Delta, Gamma, Theta, Vega, and Rho. And Delta and Gamma are important because they determine dealers’ (options sellers like investment banks, hedge funds, and prop traders) hedging activity.
When investors buy call options, dealers hedge their exposure by purchasing the underlying asset (which causes the SPX to rise). As the dance continues, it manifests itself into a positive feedback loop where: speculators buy SPX call options … dealers hedge (by purchasing SPX ETF shares or using similar hedges) … the SPX rises … speculators buy more call options.
Rinse, repeat.
However, while the merry-go-round can continue for some time, eventually, when the dynamic reverses, it has the opposite effect. Instead of dealers’ hedging activity leading the stock market higher, the offloading of hedges – which occurs when call buyers stop rolling over their contracts – often leads the stock market lower. As a result, a further decline in call option buys could result in a material number of shares hitting the open market.
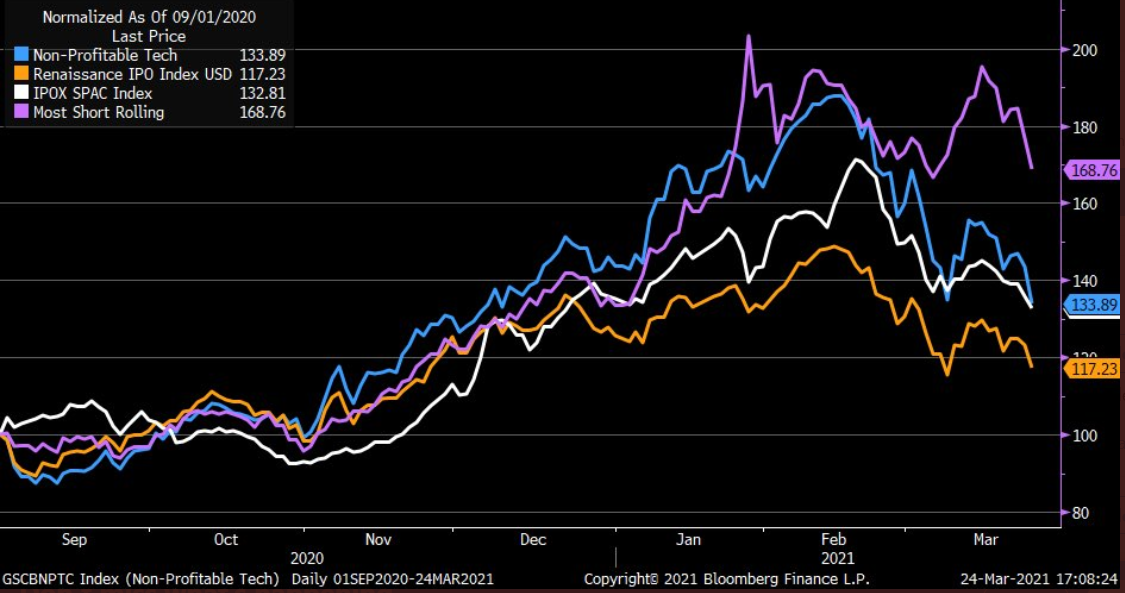
Influencing retails’ behavior, speculative stocks are now bubbling beneath the surface. If you analyze the chart below, you can see that the Renaissance IPO index, the SPAC index, non-profitable tech, and a basket of the most-shorted stocks have all broken down.
Source: Liz Ann Sonders
To that point, I warned on Mar. 22 that Big Tech is slowly letting the air out of the S&P 500’s balloon.
I wrote:
The NASDAQ Composite – which led equities’ rally in 2020 – has become a drastic underperformer. A mile away from new highs, not only has equities’ leadership changed, but the NASDAQ Composite could also be in the early innings of forming a bearish head and shoulders pattern.
Please see below:
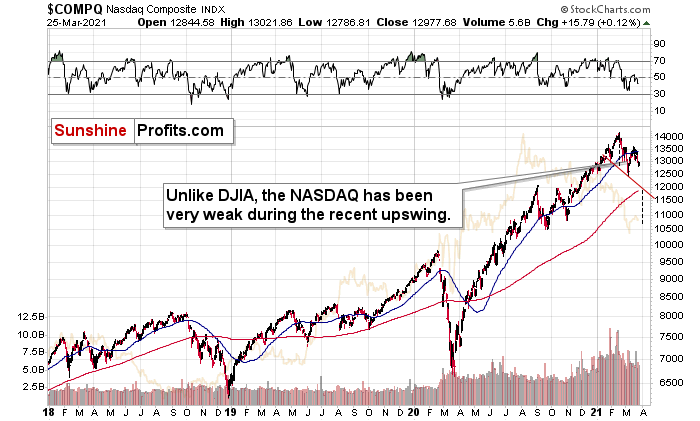
For context, the potential H&S pattern is still relatively immature. But if the NASDAQ Composite breaks below ~12,000 (the neck level), a drawdown to ~10,500 (the mid-2020 lows) could be next in line. Remember, the six largest companies in the NASDAQ Composite – Apple, Microsoft, Amazon, Tesla, Facebook, and Alphabet – are also the six largest companies in the S&P 500. Thus, a drawdown of the former will weigh heavily on the latter. Likewise, a potential equity route is profoundly bearish for the PMs, as silver and the miners will likely be the hardest hit.
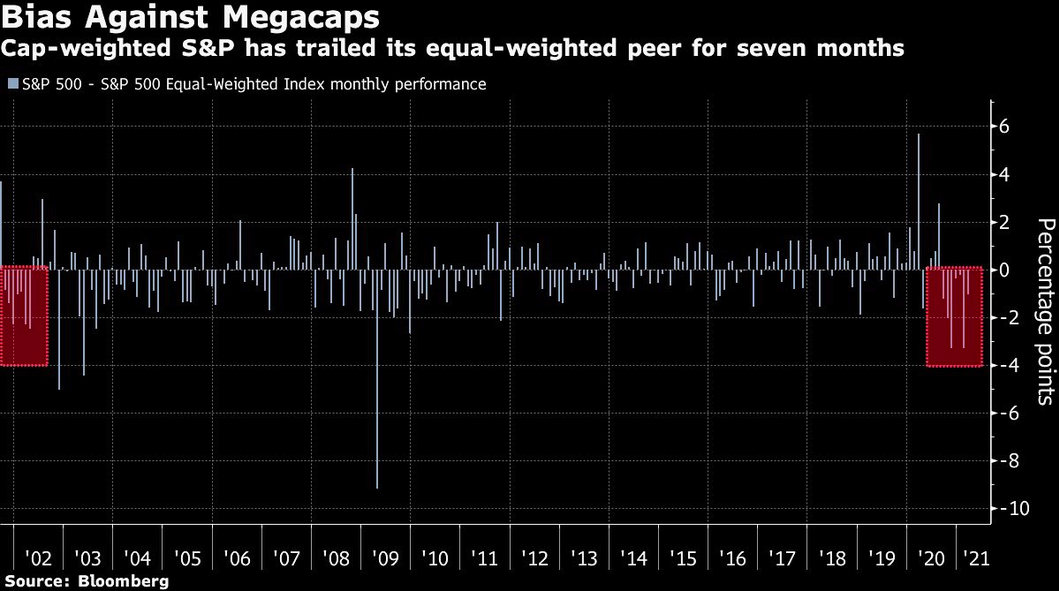
And because where there’s smoke there’s fire, the S&P 500 equal-weight index has outperformed the S&P 500 – a market-cap weighted index where the six names above have the most influence – for seven-straight months. To highlight the significance, it’s the longest streak since the dot-com bust.
Please see below:
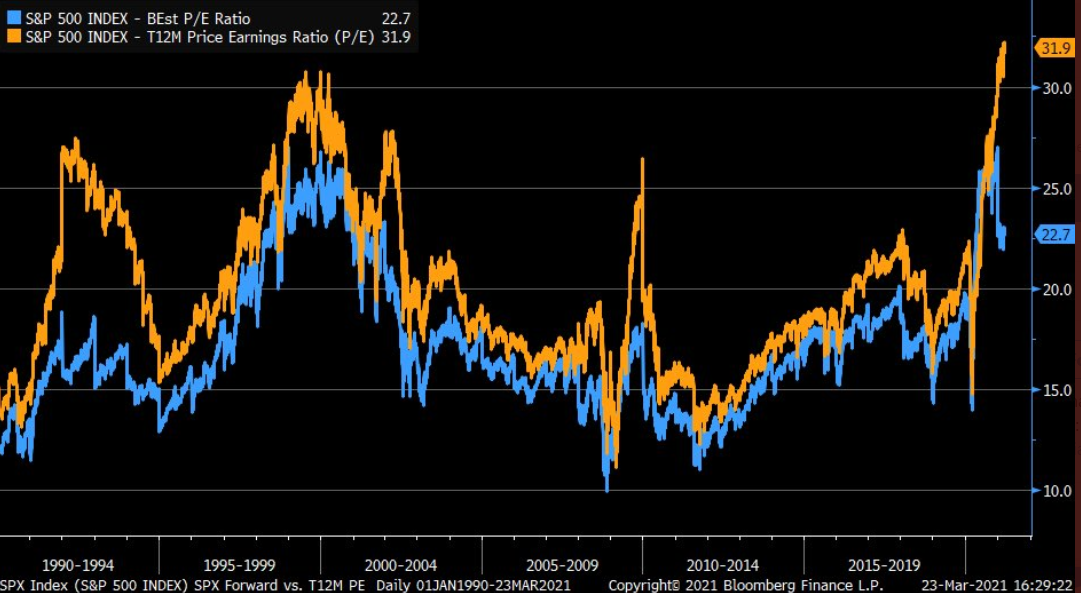
In addition, while the S&P 500’s forward price-to-earnings ratio (P/E) is more than 28% above its five-year average (17.7x) and nearly 44% above its 10-year average (15.8x) (Source: FactSet), the S&P 500’s trailing P/E is by-far the highest on record.
Please see below:
Source: Liz Ann Sonders
For context: Forward P/E estimates compare current stock prices to analysts’ forecasted earnings per share (EPS) over the next 12 months. Conversely, trailing P/E’s compare current stock prices to companies’ actual EPS over the prior 12 months.
Thus, even if we take analysts’ estimates at face value, the S&P 500 would have to decline by more than 22% to reconnect with its five-year average forward P/E. Furthermore, if analysts’ optimistic estimates don’t come to fruition, the S&P 500 would have to decline by more than 32% to reconnect with its five-year average trailing P/E.
If not ... Bank of America suggests that investors should brace for a 2% return (CAGR) over the next 10 years.
Please see below:
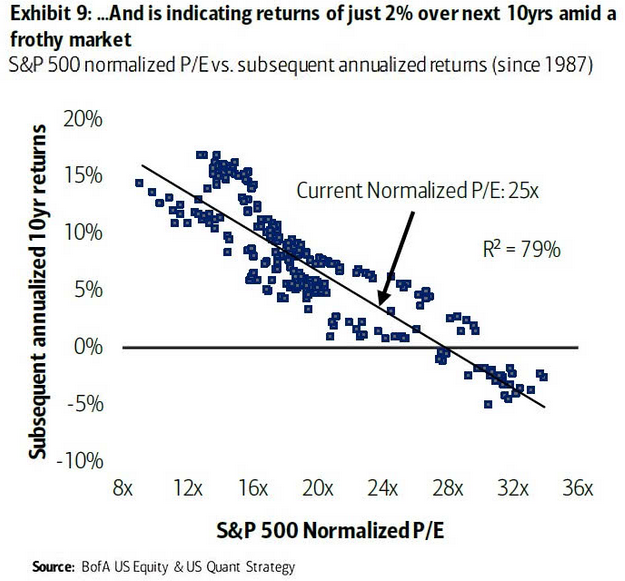
For context, a ‘normalized’ P/E excludes non-recurring items from the denominator (adjusted EPS). And with a current normalized P/E of 25x, even long-term returns are essentially non-existent.
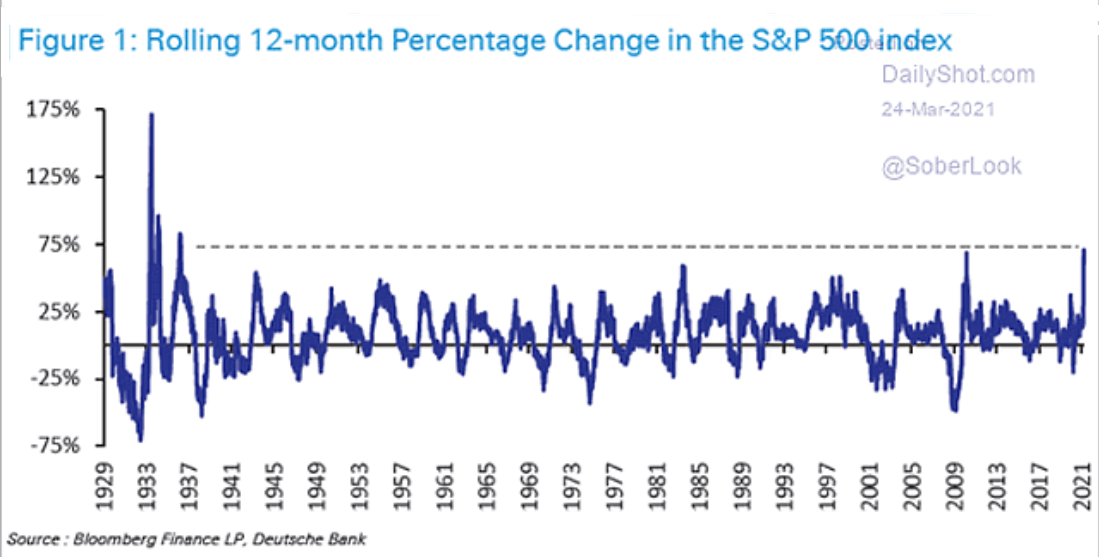
More importantly, though, short-and-medium term returns don’t materialize so smoothly. And because the S&P 500 just recorded its highest 12-month percentage change since 1936, notice below how large aberrations are often followed by large reversions?
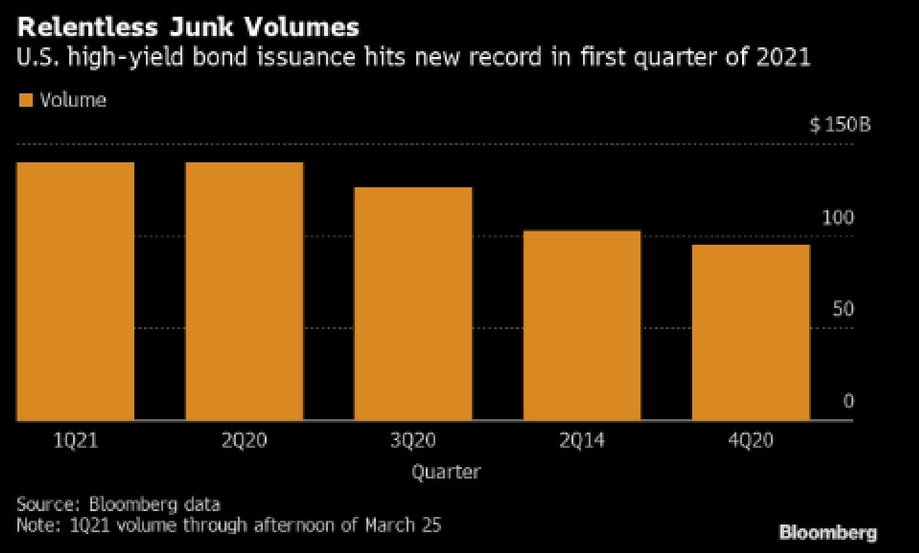
However, if history is any indication, investors refrain from pricing in risk until it’s too late. Case in point: U.S. high yield bond issuance hit another record in Q1:2021.
Please see below:
Funny, I warned on Mar. 24 that U.S. high yield credit spreads could be about to sneak up on investors.
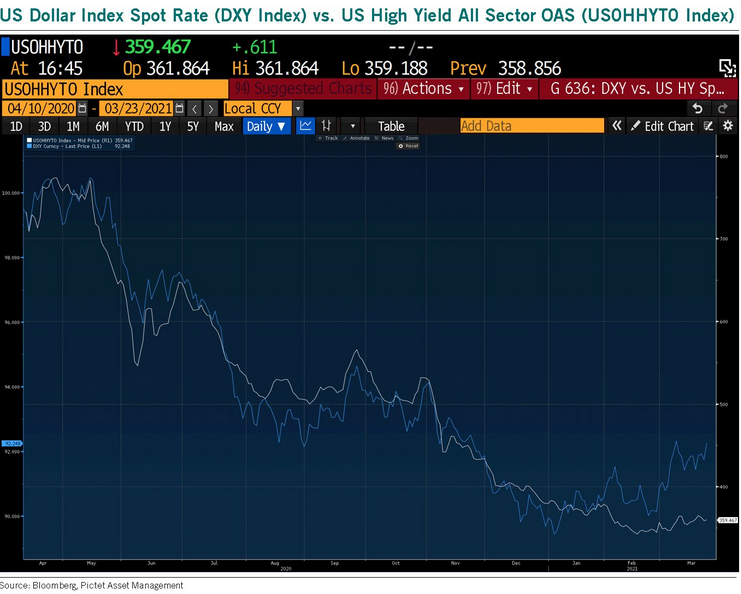
I wrote:
U.S. high yield credit spreads tend to track the performance of the USD Index. On a downward spiral since April 2020, if you analyze the right side of the chart, you can see that the USD Index has already begun to decouple. Thus, if U.S. high yield credit spreads follow, the move will likely raise alarm bells across U.S. equities.
As another short-term variable, pension rebalancing is scheduled to occur by the end of the month. To maintain target weights (say 60/40), pension funds have to sell stocks (after rallies) and buy bonds. And because pension funds are materially overweight stocks – with cash levels also at historic lows – it could result in some near-term selling pressure.
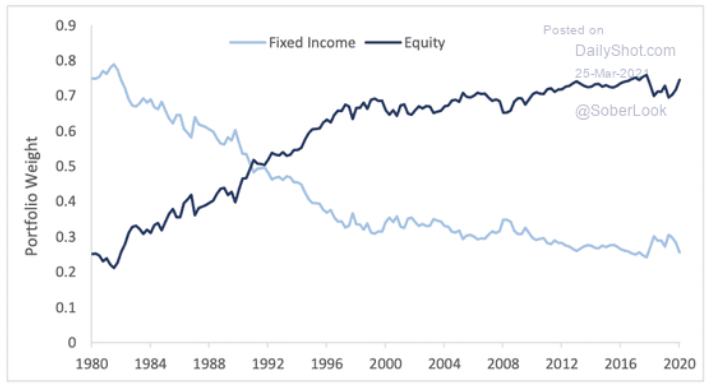
Source: The Daily Shot
In conclusion, the PMs remain destined for devaluation. And if equity weakness enters the equation, it will make the drawdown all the more painful. Moreover, while market participants are fine with looking the other way, large intraday price swings aren’t indicative of a healthy market. In addition, when you combine record valuations with the fact that ‘coronavirus variants’ and ‘mutations’ are increasingly making headlines, investors are perfectly positioned for an environment that’s far from perfect. As a result, the PMs are likely to suffer another meaningful slide before they find a lasting bottom.
Disclaimer: All essays, research, and information found on the Website represent the analyses and opinions of Mr. Radomski and Sunshine Profits' associates only. As such, it may prove wrong ...
more

