
E&P Activity Pushes Higher While Efficiency Stalls
“Davidson” submits:
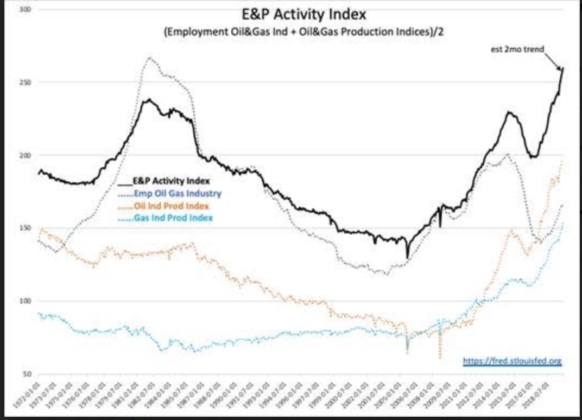
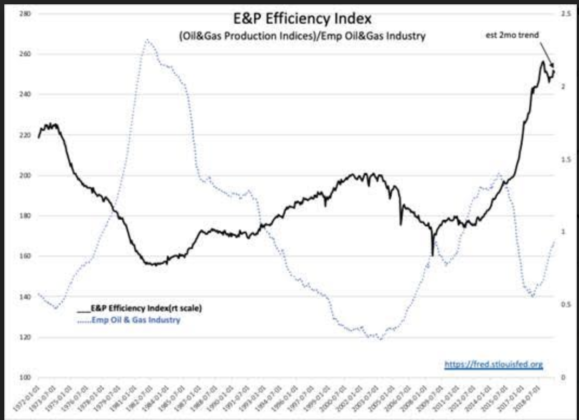
E&P Indices based on employment and production indices show higher employment and higher production of oil; and natural gas pushed the activity index higher, but the trend in the efficiency index has stalled vs last month. The last 2mos of the natural gas production index is estimated.
(Click on image to enlarge)
(Click on image to enlarge)
Employment bottomed in 2003 which was the year the US began to ramp Exports Refined Products. There was a dip in 2008 (falling 10,000 from Dec 2008 level of 167,000)with the recession but the greatest decline came on the heels of Russia’s invasion of Ukraine in 2014 triggering a surge in the US$(US Dollar) which collapsed oil prices, lowered cash flows and saw a 60,000 decline from Dec 2014.
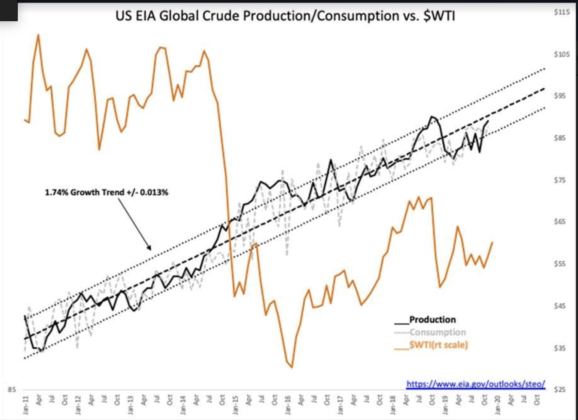
While most analysts still speak of supply/demand factors influencing oil prices, EIA data of global Production/Consumption trends make it clear that these trends were not impacted by the price swing in 2014-2016. This is a clear example of market psychology based on misperceptions driving an entire industry into recession as was experience in E&P 2014-2016. A pall still lingers on this industry with the emergence of ESG(Environmental Sustainability Governance) themed investing.
Resources continue to flow into E&P as economic demand continues to drive consumption of oil and gas.
(Click on image to enlarge)
Disclosure: The information in this blog post represents my own opinions and does not contain a recommendation for any particular security or investment. I or my affiliates may hold positions or ...
more

