
DXY Weakness: Are You In A Crowded Commodities Trade?
Have you been long commodities like agriculture or oil? The US Dollar has continued to weaken, but is this trade getting a little long in the tooth?
Happy Hump Day, folks. Here are some quick facts: The US dollar has been in a steep downtrend since late March. The most recent CPI print in the US was a monster. The Fed has continued with the “lower for longer” theme. The Biden administration is looking to spend trillions upon trillions with no clear path for repayment, and it doesn’t seem to matter. Has the short dollar/long commodities trade gotten “too easy"?
The answer is yes, or at least most likely. Some steam will have to come out at some point. I’m not setting off any immediate alarm bells here and don't care to theorize on whether inflation is indeed transitory, as the Fed states. However, when a trade theme has that much going for it, for so long, in leveraged markets, it usually ends suddenly or at least experiences a snapback. Just some food for thought.
The US Dollar Index (DXY) can give us some clues.
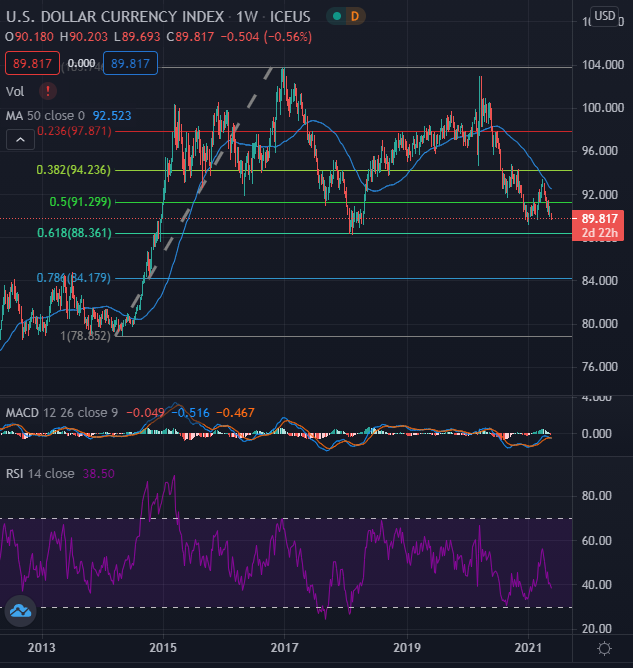
Figure 1 - US Dollar Currency Index Weekly Candles April 2012 - May 18, 2021. Source tradingview.com
In the above long-term US Dollar Index chart (DXY, weekly candles), we can see the long-term picture beginning back in April of 2012. We can see the long-term Fibonacci levels by starting near the lows in 2014 near the 78 - 79 handles, and using the high levels in December 2016 when it traded north of 103.50. We can see that some major support was found in Q1 2018 right at the 61.8% retracement level near 88.36. This area is a long-term level, folks, and it held up very well on its last attempt. The DXY did trade in a range near this level for several months before bouncing and turning upward. Could we be in for a similar setup shortly? Since we are so close to this key level, I believe this is worth a mention and some thought.
Digging deeper, to get a broader look at commodities, we turn to the S&P Goldman Sachs Commodity Index (SPGSCI). You could also look at the Invesco DB Commodity Index Tracking Fund (DBC), which is very liquid, but let's look at the SPGGSCI.
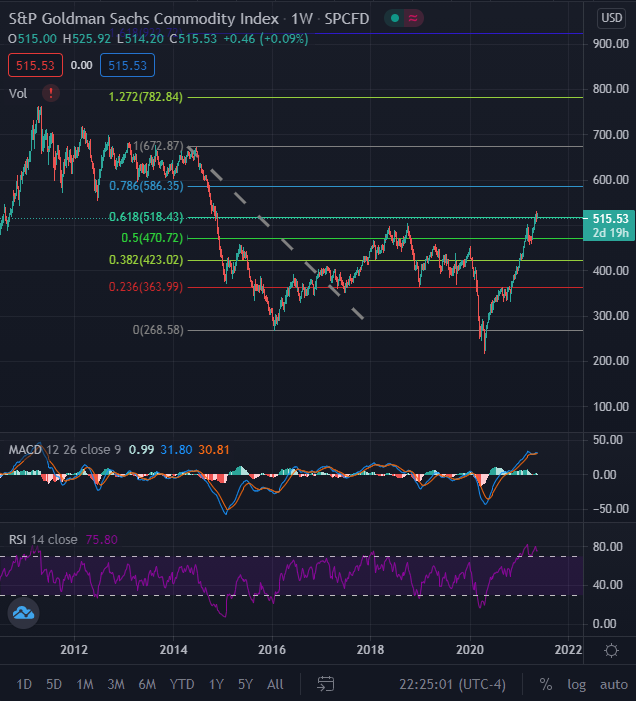
Figure 2 -S&P Goldman Sachs Commodity Index Weekly Candles (SPGSCI) July 2010 - May 18, 2021. Source tradingview.com
If you are a fan of Fibonacci retracements/extensions/time zones, you may wonder why I would draw the retracements in this way. Well, I am omitting the outlier that was Q1 of 2020 and seeing how it looks. Remember having sub-zero crude oil in March of 2020? That would certainly impact the pricing of this index. So, I omitted it. We can see weekly overbought technicals via the RSI(14) and the MACD(12,26,9), showing what may be a bearish crossover in the making in the MACD. The 61.8% retracement level here shows a 518.43 level (the way I have drawn it), and this is something to consider. Seems a bit technically overbought, yes?
Since I have opened this rabbit hole in search of a tradable opportunity, let’s look at the Invesco DB Commodity Index Tracking Fund (DBC), but on a shorter-term basis.
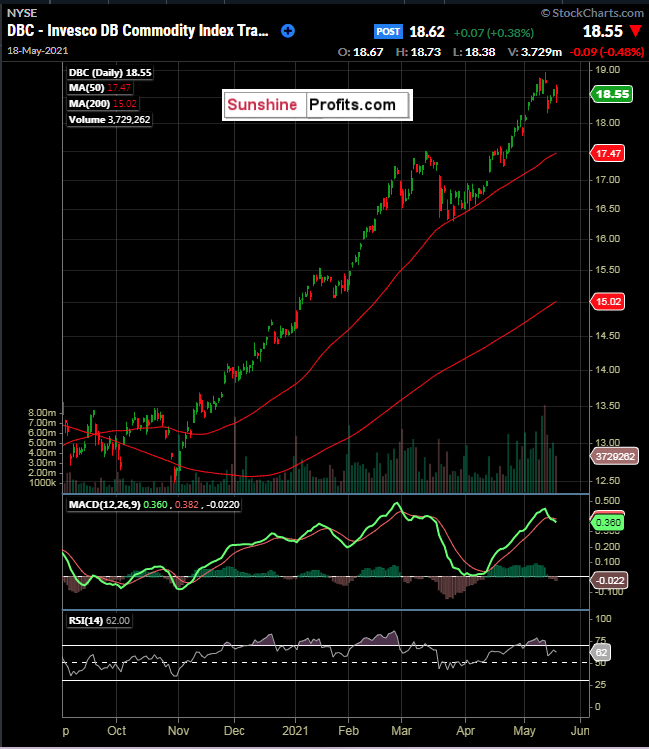
Figure 3 - Invesco DB Commodity Index Tracking Fund (DBC) Daily Candles September 3, 2020 - May 18, 2021. Source stockcharts.com
It has been a great trade from the long side. There is no doubt about it - from the bottom left of the chart to the top right, with a steep slope. I am always a “trend is your friend trader” first, as getting on the wrong side of a trend can be damaging, and very quickly. However, in this instance, I believe we need a closer look at what may be in the cards for the US Dollar and commodities.
Disclaimer:
This content is for informational and analytical purposes only. All essays, research, and
information found above represent analyses and opinions of Rafael Zorabedian, ...
more

