
Does “Run On Silver” Have More Fuel To Burn?
After GameStop (GME), silver was the next big target, but the investor frenzy seems to be showing signs of fatigue. Is the run on silver over?
I recently emphasized that silver’s volatile upswing is likely just temporary, and I discussed the Kondratiev cycle which implies much higher gold prices but not necessarily right away because the value of cash (USD) would be likely to soar as well. The latter would likely to trigger a temporary slide in gold.
Well, was silver’s rally temporary?
(Click on image to enlarge)
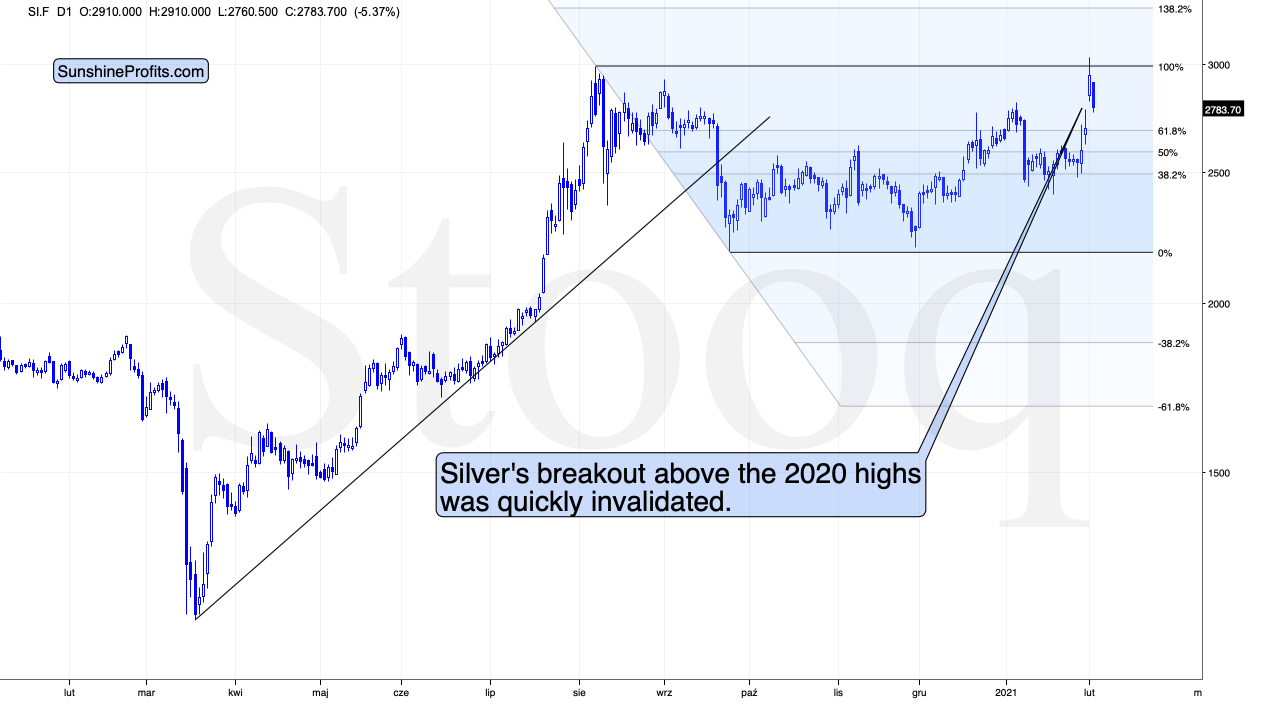
Figure 1 – COMEX Silver Futures
That seems to have been the case. Let’s examine the short-term silver chart above.
On a short-term basis, silver is showing strength – also yesterday (Feb. 1), when it rallied slightly above the early-September high. Perhaps the final part of those who might have been inclined to buy based on the “silver manipulation” narrative and the forum encouragements in general, have decided to make their purchases over the weekend, and we saw the result in yesterday’s trading.
This, coupled with the miners’ relative weakness means that the bearish outlook remains intact. If it “feels” that the precious metals market is about to take off, but the analysis says otherwise, then it’s very likely that the PMs are topping. That’s what people see and “feel” at the top.
While silver moved close to its 2021 highs, the GDX ETF moved close to its 2021 lows – the relative underperformance of the latter is striking.
Silver invalidated the breakout above the 2020 highs. During today’s trading, silver is already down quite visibly. It’s now apparent that the silver world is not ending, and that silver’s price doesn’t have to keep on climbing. Is the silver shortage here? Not necessarily. Some bullion products might be in short supply and it wouldn’t be the first time this is the case. The size of the silver market is not that small after all.
Silver had many strong short-term run-ups in the past, and in the vast majority of cases, when they corresponded with relatively weak performance of mining stocks, it meant that lower prices for the precious metals sector are to be expected, not higher ones. This also implies a bearish forecast for silver in the medium term.
(Click on image to enlarge)
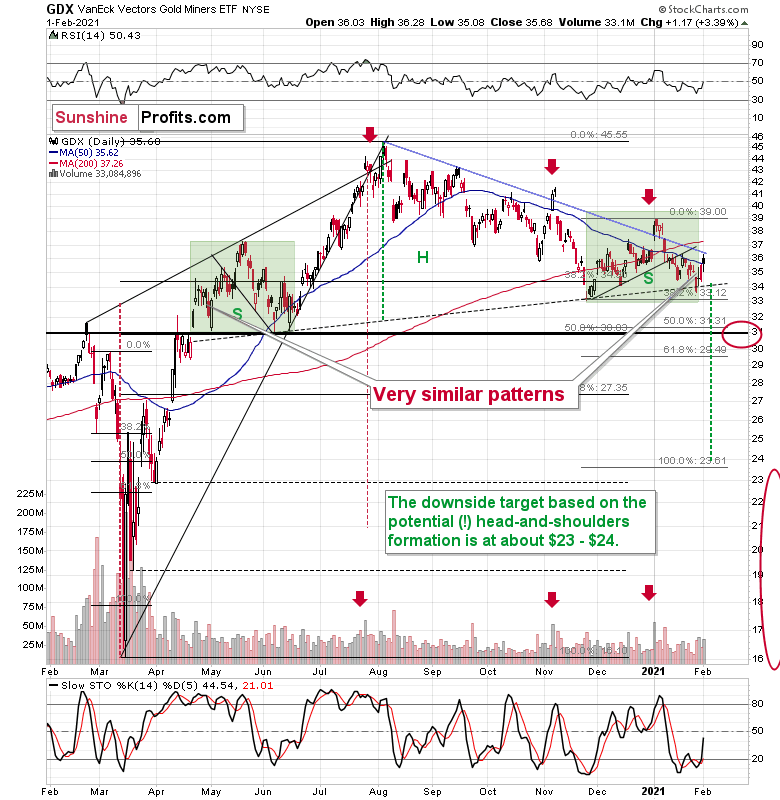
Figure 2 – VanEck Vectors Gold Miners ETF (GDX)
Are miners weak right now? Of course, they are weak. It was not only silver that got attention recently, but also silver stocks. The GDX ETF is mostly based on gold stocks, but still, silver miners’ performance still affects it. And… GDX is still trading relatively close to the yearly lows. Silver moved a bit above its 2020 highs – did miners do that as well? Absolutely not, they were only able to trigger a tiny move higher.
Interestingly, the most recent move higher only made the similarity of this shoulder portion of the bearish head-and-shoulders pattern to the left shoulder (figure 2 - both marked with green) bigger. This means that when the GDX breaks below the neck level of the pattern in a decisive way, the implications are likely to be extremely bearish for the next several weeks or months.
The GDX is still likely to form an initial (!) bottom close to $31, though.
(Click on image to enlarge)
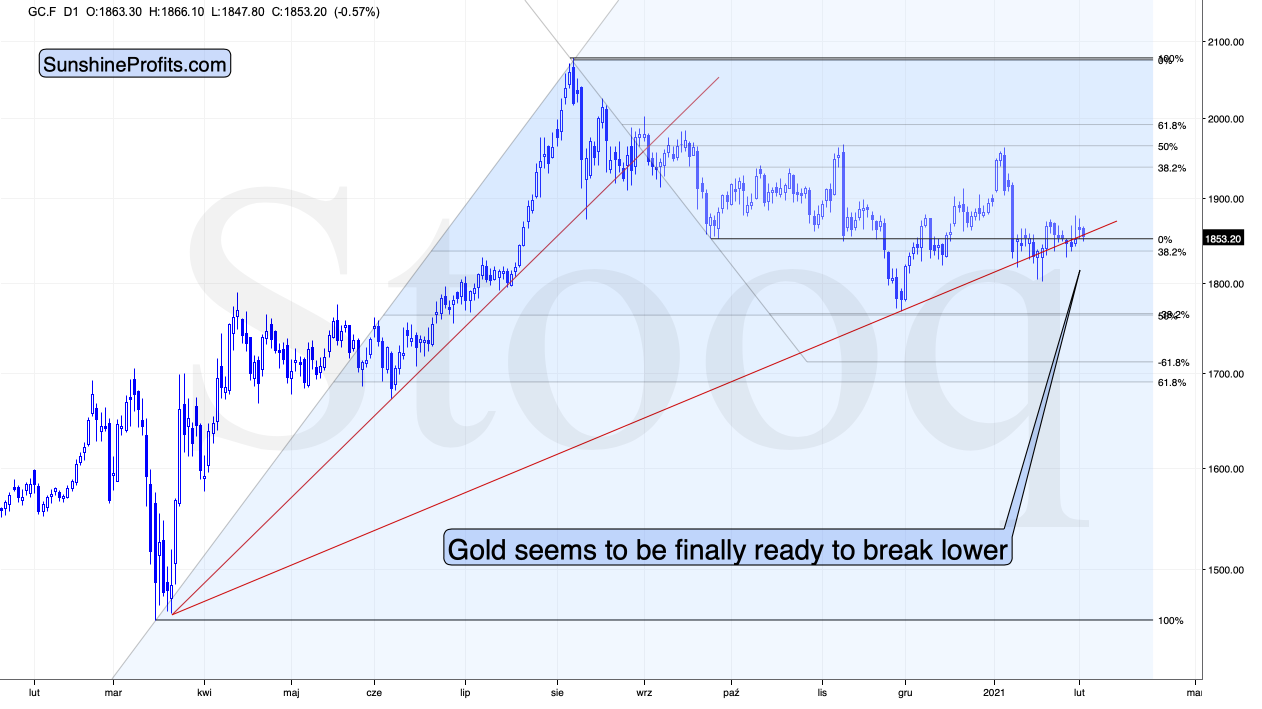
Figure 3 - COMEX Gold Futures (GC.F)
Despite yesterday’s higher close, gold is already back down in today’s pre-market trading. All that we saw recently was a back-and-forth movement that was a part of a consolidation which started after gold declined earlier this year in a volatile manner.
Please note that the thing that prevented gold from declining further right away, was the rising red support line based on the March 2020 and November 2020 lows. In all cases, when gold was about to break below this line, it ultimately moved slightly higher. Right now, gold is making another attempt to break below it. It seems quite likely that this attempt will be successful.
You already know about the key, crystal-clear point that confirms this outlook – very strong relative performance of silver and very weak relative performance of mining stocks.
The second important short-term detail comes from the USD Index, which just moved to a new yearly high.
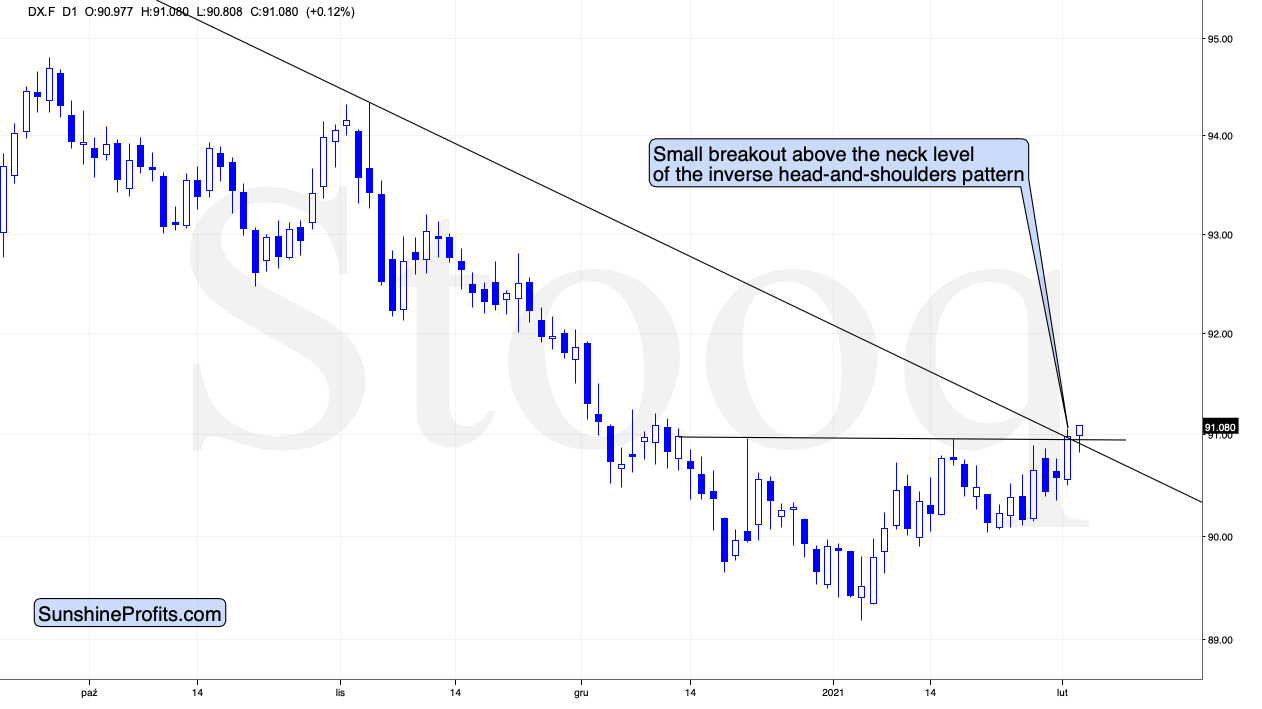
Figure 4 - USD Index
The move to a new yearly high is not that important as the move above the neck level of the inverse head-and-shoulders pattern. This breakout is not yet confirmed, but once it is confirmed, it’s likely to trigger another powerful upswing.
And another short-term rally here will mean a decisive move above the medium-term declining resistance line and USD’s 50-day moving average. Please take a look at the below chart for details.
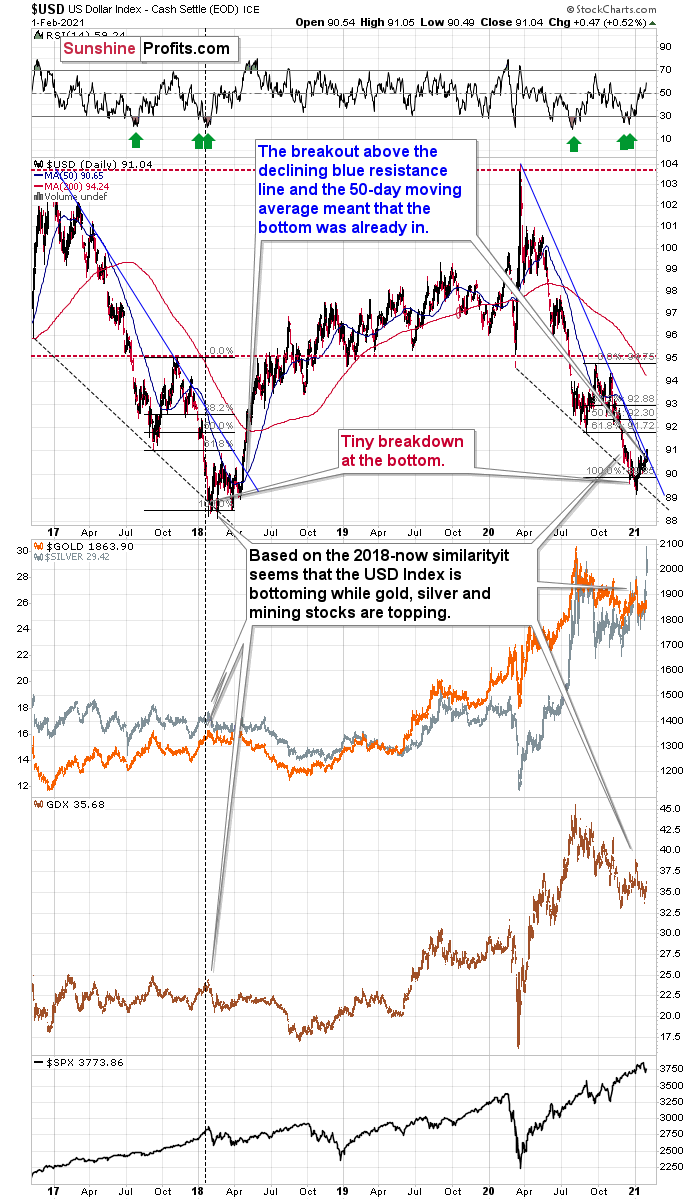
Figure 5
Yesterday’s close of 91.04 was above both the declining blue resistance line and the 50-day moving average (90.65).
When we saw this kind of double breakout back in 2018, it meant that the bottoming process was complete and that one should buckle up for a sharp upswing. The implications are very bullish for the USD Index and very bearish for the precious metals sector.
Disclaimer: All essays, research, and information found on the Website represent the analyses and opinions of Mr. Radomski and Sunshine Profits' associates only. As such, it may prove wrong ...
more

