
Despite Signs To The Contrary, Gold At Or Near Top
The thing that most likely raised quite a few eyebrows this week was – in addition to gold’s recent move by itself – the fact that gold rallied mostly without the dollar’s help. Tuesday, January 5, I wrote that one swallow doesn’t make a summer and that a single session rarely changes much. We didn’t have to wait for long – the situation already appears to be getting back to normal.
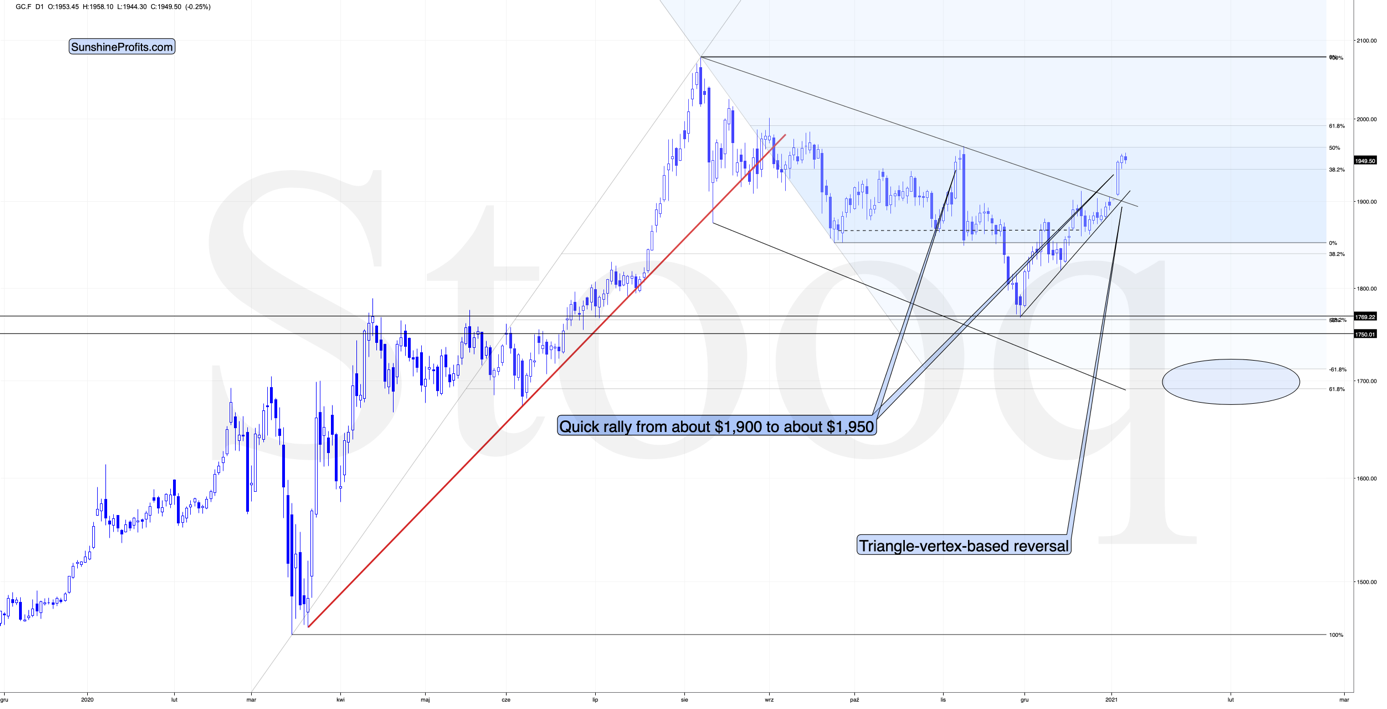
Figure 1 - COMEX Gold Futures
After the Jan. 4 rally, gold moved only insignificantly higher, and it’s even a bit lower in Wednesday, Jan. 6's pre-market trading.
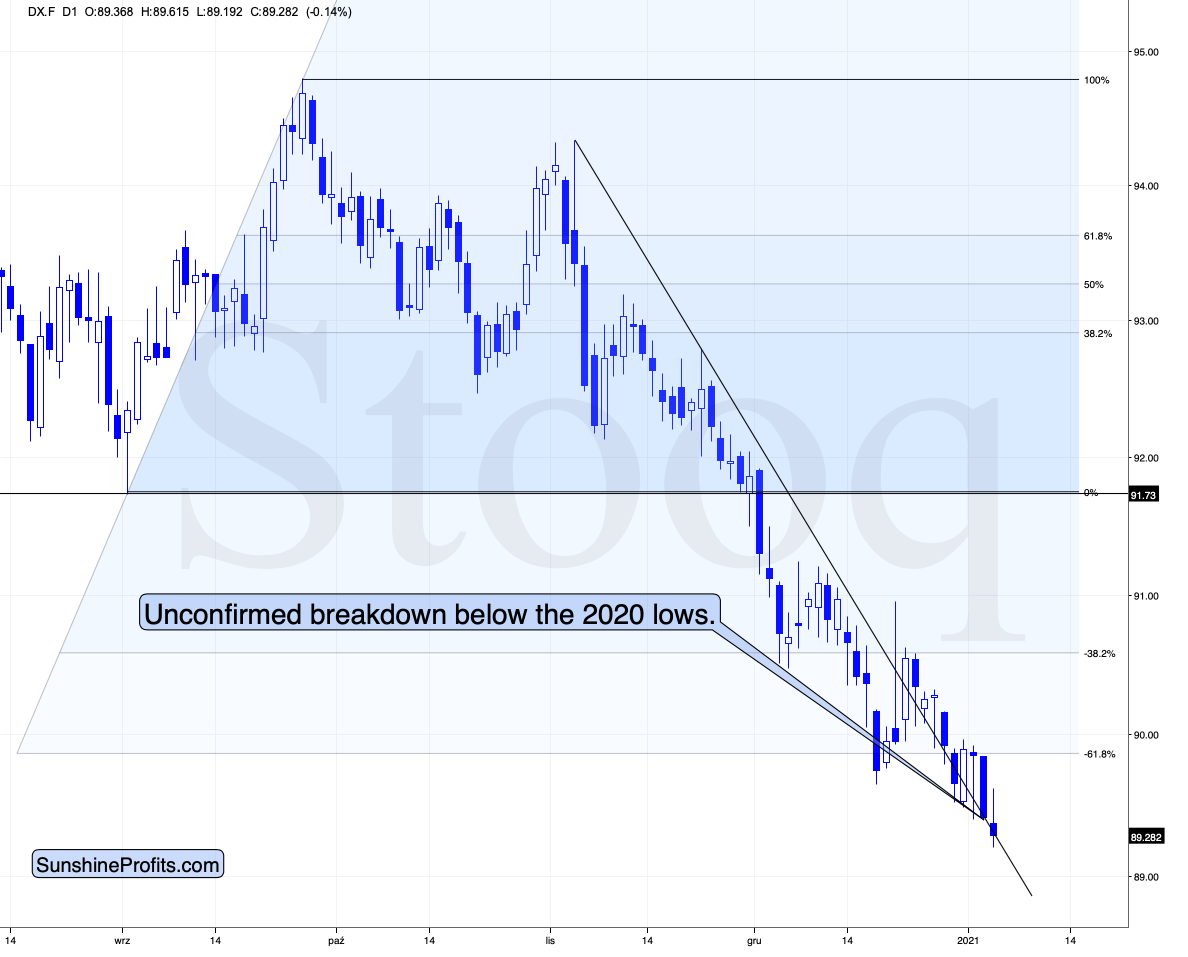
Figure 2 - USD Index
While the USD Index didn’t decline on Jan. 4, it did in the following days – yesterday and in today’s pre-market trading. So, the gold-USD link seems to be relatively normal after all; it doesn’t, by itself, indicate further relative strength in gold. There are three important things that one needs to note here.
The first one is what I already wrote previously – gold is not even above its Nov.. 2020 high, while the USDX is below its 2020 low, which means that gold is weak relative to the USD Index and Jan. 4's rally seems to have been an exception.
The second one is also something that I wrote about previously – gold is right at its triangle-vertex-based reversal and it might have just topped (given its tiny decline despite a decline in the USDX).
The third one is that the USD Index has quite a steep declining resistance line that’s based on the early-November and late-November highs. Each previous attempt to break above it that we saw in the last few weeks failed. But thanks to the steepness of the line, the USD Index is at this line even despite today’s decline.
All it takes for the USD Index to break above it is for it to do nothing. This should be relatively easy given how excessive the bearishness is in this market, how similar it is to what we saw in early 2018, what’s happening in the RSI, and even given the similarity between 2018 and now in the cryptocurrencies. You can see the details on the chart below.
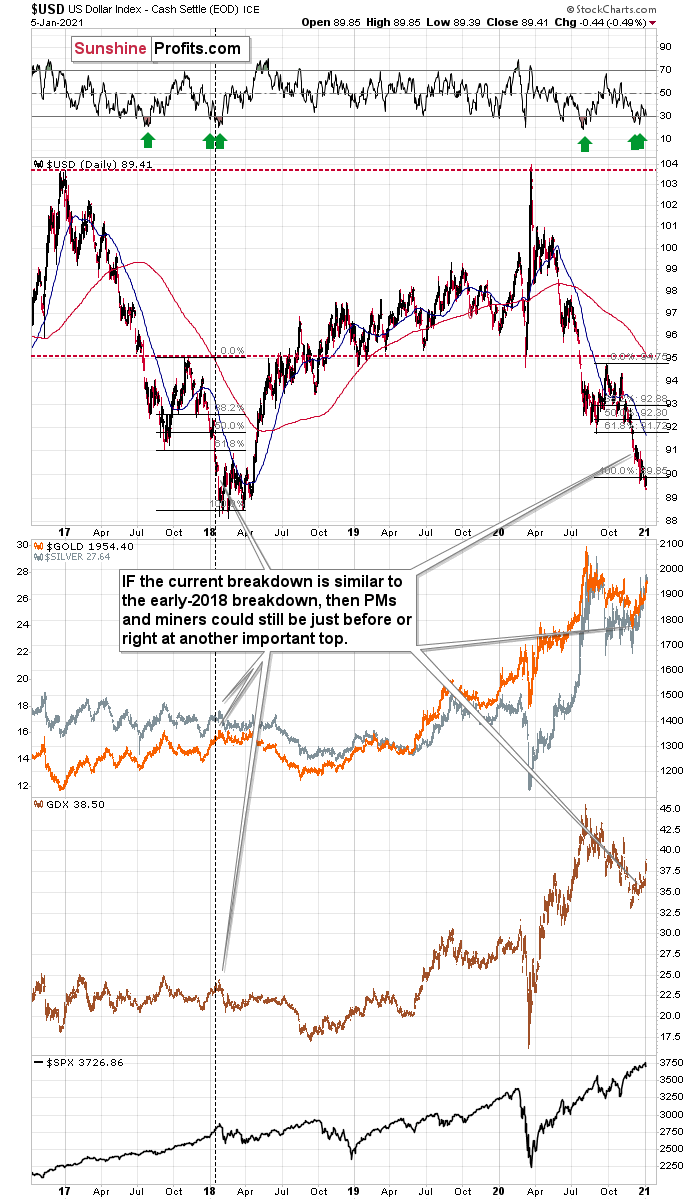
Figure 3 - USDX, USD, GOLD, GDX, and SPX Comparison
By the way, someone who is not interested in markets or investments at all just called me yesterday to ask if I can help an individual they knew with cryptos – this is a classic case study of something that you see in the final stages of a price bubble. It’s an example of the general public buying, and they tend to enter at the tops. Bitcoin (BITCOMP) is at about $35,000 when I’m writing these words - you have been warned.
How does it all combine? The gold-USD link is intact and a soaring USDX would likely trigger a sell-off in gold. There are many reasons due to which the USDX is likely to rally soon, even the situation in the cryptocurrency market makes the current time similar to early 2018. The triangle-vertex-based reversal in gold is emerging right about now, so it seems that we won’t have to wait for long.
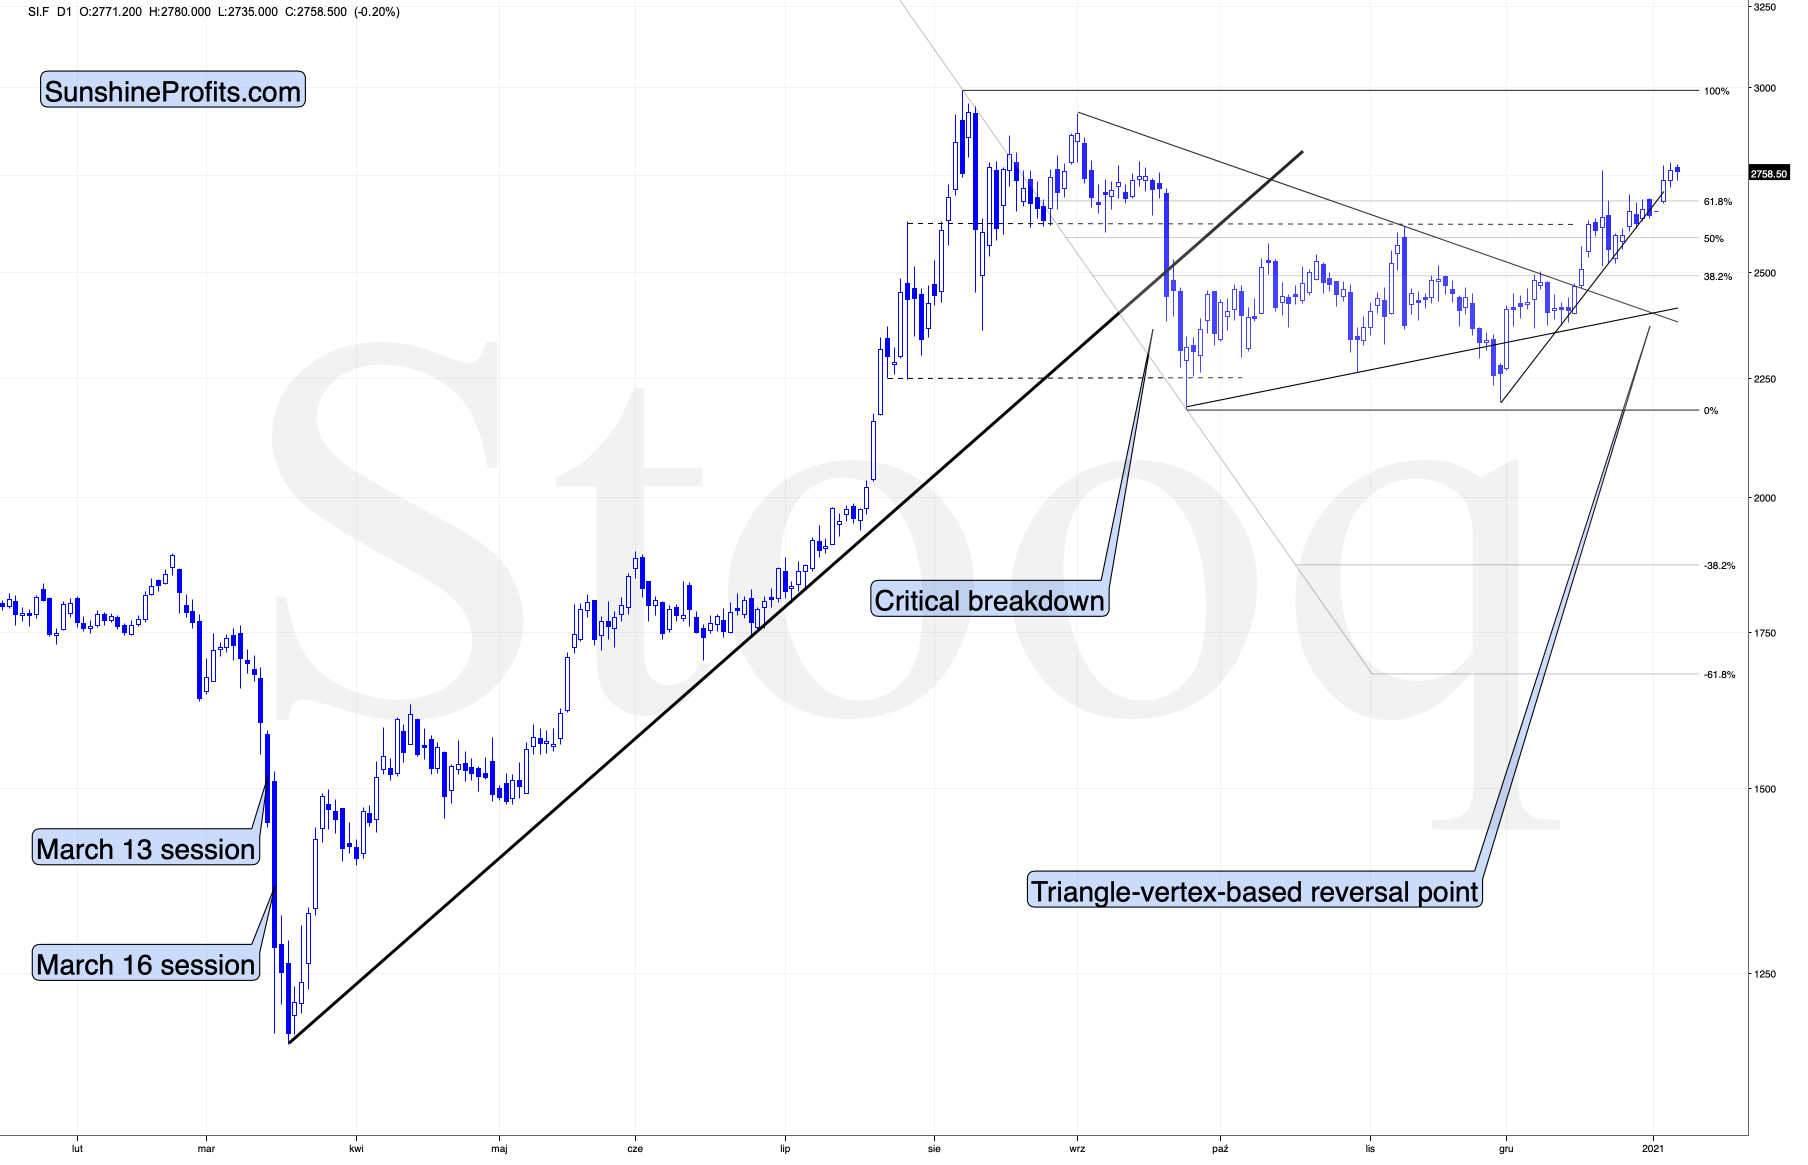
Figure 4 - COMEX Silver Futures
Additionally, silver is showing strength.
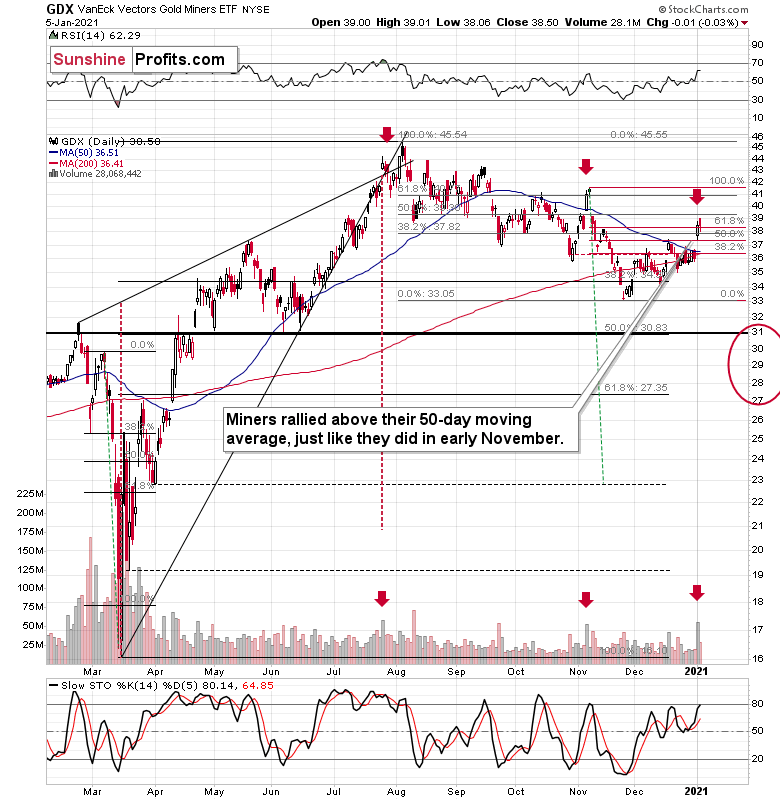
Figure 5 – VanEck Vectors Gold Miners ETF
Miners, however, are not showing strength. They even declined Jan. 5 (by just one cent, but still) while gold moved a bit higher, but this is just a small confirmation of what we’ve been seeing for many weeks.
Let’s study the above chart. Miners were underperforming gold for many days and weeks, and they showed strength on Monday. Just like in the case of gold – it was a one-day phenomenon, and one swallow doesn’t make a summer.
During the day, the GDX ETF managed to rally above its 50-day moving average – just as it did at its November top. Unlike gold, miners are not very close to their November high. They corrected about 61.8% of the decline from this top. Moreover, please note that miners have corrected about 38.2% of the August – November decline.
They haven’t even erased half of the decline that occurred in the previous months – so it’s definitely too early to say that miners started a new powerful rally here. Instead, we see that miners are making lower lows and lower highs.
Moreover, please take note of the spike in volume that we saw on Monday. There were very few cases when we saw something similar in the previous months, which was at the November high and at the July high, right before the final 2020 top. The implications are bearish.
Disclaimer: All essays, research, and information found on the Website represent the analyses and opinions of Mr. Radomski and Sunshine Profits' associates only. As such, it may prove wrong ...
more

