
Crude Oil markets are seeing a moderate recovery on Friday with West Texas Intermediate (WTI) climbing two percent on the day, but pressured oil markets are still set for a seventh straight week of declines.
The Organization of the Petroleum Exporting Countries (OPEC) scrambled to solidify a group-wide agreement on production cuts after member states came to loggerheads over pumping quotas. Key OPEC members, headed up by Saudi Arabia, have aggressively pursued tighter production caps in order to keep Crude Oil prices bid. However, flagging fuel demand, specifically from China, and disobedient OPEC member states decrying production caps are throwing a wrench in OPEC’s efforts to intentionally undersupply global Crude Oil Markets.
OPEC’s current production caps see the oil cartel agreeing to a combined 2.2 million bpd cut to total Crude Oil production through the first quarter of 2024, but fossil markets remain skeptical about OPEC’s ability to enforce the loose agreement.
OPEC currently has no mechanism of enforcing Crude Oil production quotas, and there is currently no punishment for member countries that choose to flaunt pumping limits and sell more oil than OPEC agreements allow.
Adding fuel to the fire, Chinese imports of Crude Oil declined by 9% in November compared to last year as Chinese demand for fossil fuels sumps alongside China’s growth metrics.
Despite OPEC’s production-limiting efforts, Crude Oil supplies remain well-stocked with barrel inventories at healthy levels, sending the price of Crude down into multi-month lows.
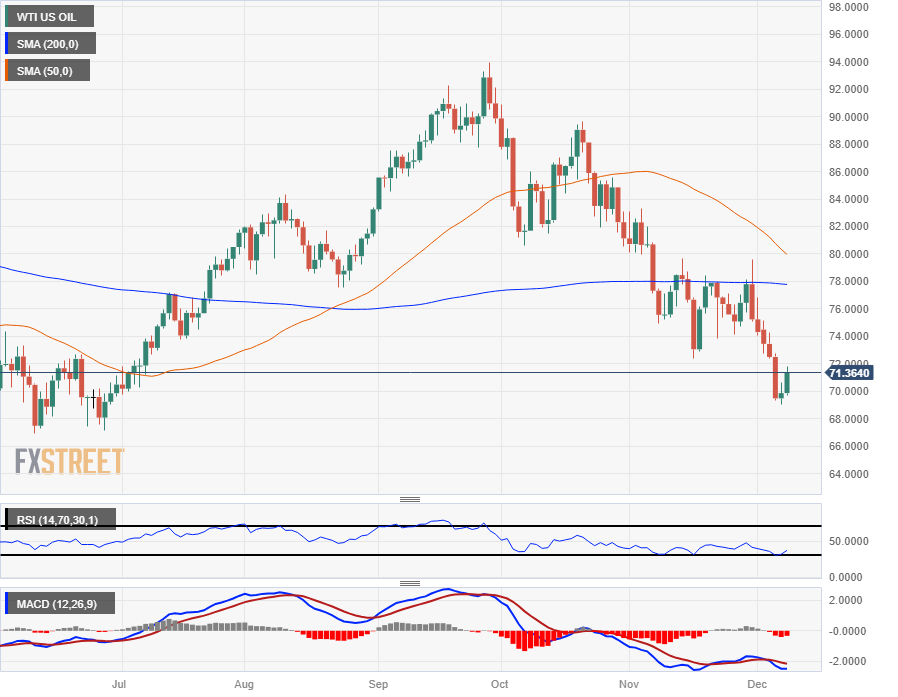
WTI Technical Outlook
Despite Friday’s rebound after finding a floor on Thursday at $69.01, Crude Oil remains firmly under-bid after closing in the red for five consecutive days into Tuesday, and WTI is on pace to end in the red for a seventh straight week.
WTI Crude Oil daily candlesticks remain firmly capped by the 200-day Simple Moving Average (SMA) near $78.00, with the 50-day SMA accelerating into the downside at $80.00.
Seven straight weeks of declines have dragged WTI down nearly twenty percent plus a half from the last peak of $89.64, and US Crude Oil is down nearly twenty-seven percent from September’s peak just below $94.00 per barrel.
WTI Daily Chart
(Click on image to enlarge)
WTI Technical Levels
WTI US OIL
| OVERVIEW | |
|---|---|
| Today last price | 71.3 |
| Today Daily Change | 1.44 |
| Today Daily Change % | 2.06 |
| Today daily open | 69.86 |
| TRENDS | |
|---|---|
| Daily SMA20 | 75.4 |
| Daily SMA50 | 80.34 |
| Daily SMA100 | 82.09 |
| Daily SMA200 | 77.81 |
| LEVELS | |
|---|---|
| Previous Daily High | 70.64 |
| Previous Daily Low | 69.01 |
| Previous Weekly High | 79.62 |
| Previous Weekly Low | 74.04 |
| Previous Monthly High | 83.34 |
| Previous Monthly Low | 72.39 |
| Daily Fibonacci 38.2% | 70.01 |
| Daily Fibonacci 61.8% | 69.63 |
| Daily Pivot Point S1 | 69.03 |
| Daily Pivot Point S2 | 68.21 |
| Daily Pivot Point S3 | 67.41 |
| Daily Pivot Point R1 | 70.66 |
| Daily Pivot Point R2 | 71.46 |
| Daily Pivot Point R3 | 72.29 |
More By This Author:
WTI Recovers Above $70.00 On Russia-saudi Joint Statement On Output Cuts
USD/JPY Drops On Its Worst Day In Over A Year, Breaches 142.00
EUR/USD Reaches Session Highs Near 1.0800 After US Jobless Claims


Comments
Log in or sign up to join the conversation.