
Crude Oil Prices Set For Weekly Gains, Virus Stokes Production Cut Talk
Crude oil prices were steady through the Asia Pacific morning on Friday, returning a few cents of the previous session’s gains, but still on track for their best week since December with production cuts still very much on market minds.
The Organization of Petroleum Exporting Countries and allies including Russia, the so-called ‘OPEC Plus’ group has recommended reductions of up to 600,000 barrels per day. Russia has asked for time to assess this demand, but the markets still think cuts are coming. Of course, there are other producers, notably the US shale extractors, and it remains to be seen what effects cuts will have on what’s clearly a well-supplied market.
Of course, the coronavirus story can never be far away from market action. China’s Hubei province managed to roil markets this week when a new clinical diagnosis method resulted in a huge surge in daily infections. That rate has come down sharply in the most recent report but all markets remain sensitive to this story.
They’re also watching for the removal of Chinese tariffs on a range of us goods worth about $75 billion annually. The removal was agreed earlier this month and takes effect Friday.
Gold prices were a little lower through the session, but they remain close to one-week highs and the coronavirus story ensures that the haven bid is never far away.
A stronger US Dollar may be taking a little of the shine off this market. Still, prices remain elevated and close to the more-than seven-year highs made in January. Looking ahead to the US session, official retail sales data and the University of Michigan’s venerable consumer snapshots stand out as broad market risk events.
CRUDE OIL TECHNICAL ANALYSIS
US crude oil’s weekly chart shows that the falls seen at the start of this year have been arrested for now, with the market confined to a much narrower range for the last two weeks.
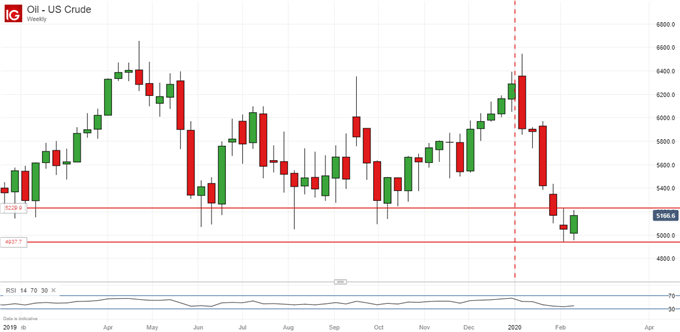
This scenario has a clear fundamental basis in the virus-linked worries about demand which characterized the start of the year, calmed since by hopes that producers will respond by limiting supply. Whether the current range proves to be any sort of durable base will depend on how these stories play out, but the market remains around its 2019 lows (made in January of that year), with late 2018’s foray down to the $45 handle lurking should more weakness come.
It seems highly unlikely that traditional producers would accept such a fall for long, however, and the bulls may now have a little upside in their sighs, possibly staring with the recapture of psychological resistance at $54.
GOLD TECHNICAL ANALYSIS
Gold prices continue to lengthen the modest daily chart uptrend channel which began to build last week.
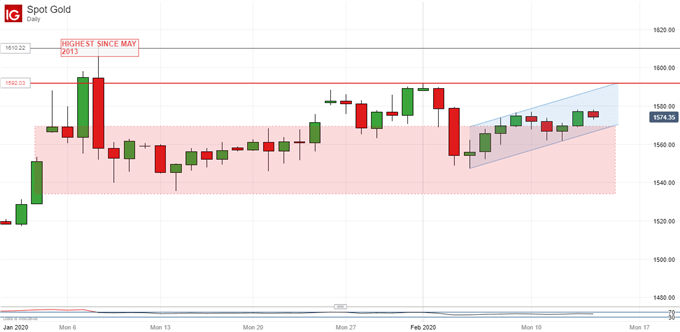
The move seems to lack a little conviction though and, although the channel is probably worth respecting, it seems to be fizzling out before the previous significant high has been taken out. That was February 2’s $1592.
The broader underlying support range looks solid enough though, even if that channel does give way, with a return to it perhaps the most likely prospect now.


