
Crude Oil Prices Mired By Trend Resistance, OPEC+ Output Boost
Crude oil showed quite a bit of resilience throughout Thursday’s trading session. The commodity climbed 3% to trade back above $61.00/bbl despite news that OPEC+ will gradually increase crude oil output. Saudi Arabia plans to unwind its voluntary 1M/bpd supply cut by boosting production 250K/bpd in May, 350K/bpd in June, and 400K/bpd in July.
The rest of OPEC+ will raise output by 350K/bpd in May and June while accelerating output another 450K/bpd in July. Crude oil prices took this development in stride as OPEC+ noted that its decision was a conservative measure that can be tweaked at its next meeting. The Saudi Energy Minister noted that the oil cartel will continue to be mindful of how the market may react, and added that OPEC+ can still adjust supply by 500K/bpd in either direction.
CRUDE OIL PRICE CHART: DAILY TIME FRAME (05 NOV 2020 TO 01 APR 2021)
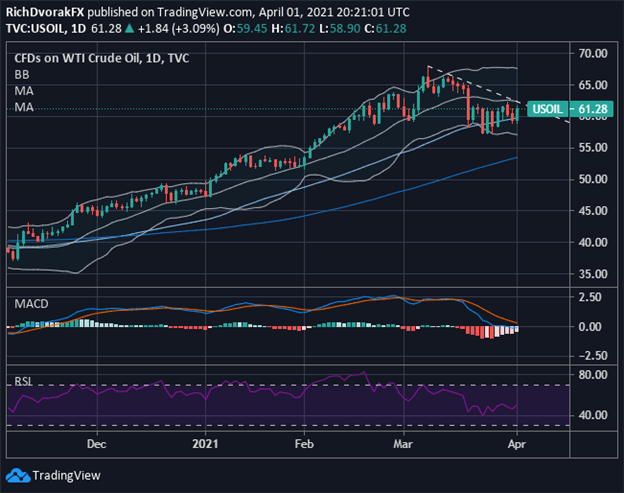
Chart by @RichDvorakFX created using TradingView
As highlighted in our weekly technical forecast, crude oil has drifted broadly sideways over recent trading sessions. This follows a healthy correction from its 08 March swing high near $68.00/bbl. The price of oil continues to find support provided by the bullish 50-day simple moving average, however and could attempting to turn back higher.
Failing to hold this area of buoyancy brings month-to-date lows and the bottom Bollinger Band into focus before the 100-day simple moving average is considered. Eclipsing the negatively-sloped trendline extended through the recent string of lower highs, which is also underpinned by the 20-day simple moving average, might coincide with a bullish MACD indicator and move toward year-to-date highs.
Disclosure: See the full disclosure for DailyFX here.


