
Crude Oil Prices May Keep Falling As PMI Data Shows Inflation Swell
Crude oil prices continued to sink, with the benchmark WTI contract recording its worst three-day performance in two months. Traders are mulling the prospect of a thaw between Washington and Tehran that might see sanctions on Iranian crude exports eased as part of a new denuclearization deal.
Iranian President Hassan Rouhani touted “major” progress in informal negotiations taking place in Vienna, saying that “the main agreement has been made”, with only the “details and finer points” left to be ironed out. Iran has the world’s fourth-largest oil reserves. Its return to market would be a major supply boost.
CRUDE OIL MAY KEEP FALLING AS PMI DATA SHOWS INFLATION SWELL
Looking ahead, the May round-up of UK and US PMI surveys is in focus on the data front. Eurozone figures passed by with little fanfare considering their minimal implications for ultra-dovish ECB policy. The Bank of England and the Fed can be envisioned speeding up stimulus withdrawal, however.
The blistering pace of economic growth in both counties over recent months is expected to continue, with the UK accelerating further while the US cools just a bit. Markets might be most interested in the inflation components within these surveys as they try to divine if the upswell in prices is temporary or not.
Investors are combing for evidence suggesting that inflation will be sticky, posing a longer-term policy challenge. For now, the Fed and most other top central banks still argue the rise mainly reflects rebasing of year-on-year calculations beyond the depths of the Covid-driven lows in the first half of 2020.
Frayed supply chains, uneven post-Covid economic reopening (and in some cases even backsliding) and growth rates overclocked by unprecedented fiscal and monetary stimulus may well mean a rethink is in order. If PMI data supports such a hypothesis, sentiment-sensitive crude oil may suffer amid broader risk aversion.
CRUDE OIL TECHNICAL ANALYSIS
Crude oil prices are extending lower as expected after clearing support at 63.53. Sellers now look poised to challenge 60.61. If that too is breached, the pivotal neckline of a would-be Double Top formation comes into play at 57.25. A daily close under it completes the pattern, implying a drop below $47/bbl to follow.
Alternatively, reversing back above 63.53 – now recast as resistance – would put the ceiling in the $66-68/bbl zone into focus. Securing a foothold above this threshold seems like a prerequisite for neutralizing near-term selling pressure and setting the stage for gains.
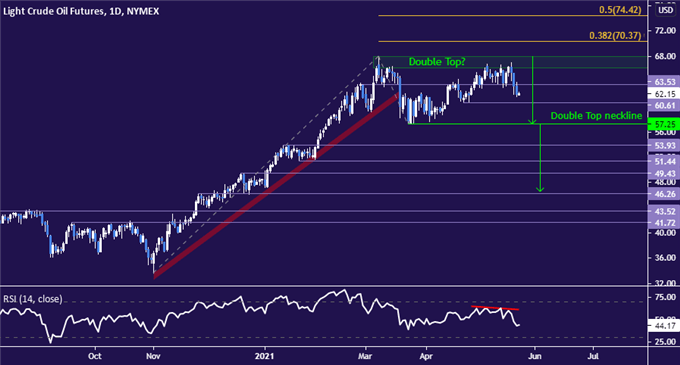
Crude oil price chart created using TradingView
Disclosure: See the full disclosure for DailyFX here.


