
Crude Oil Prices May Fall On US-China Tension, Trump Speech Eyed
Crude oil prices rose as Iran made a show of unveiling scores of new and improved defensive speedboats while threatening the US. EIA inventory data showing stockpiles added 7.93 million barrels last week – the most in a month – did not seem to inspire meaningful selling pressure. The total stock – excluding the Strategic Petroleum Reserve – is now at the highest in over three years as the Covid-19 outbreak saps demand.
Gold prices tracked higher in a move that seemed corrective following losses earlier in the week. The metal would not make much progress however, with markets seemingly lacking a potent-enough catalyst. Lingering US Dollar weakness probably helped set a broadly positive tone, but the absence of a clear risk-on vs. -off sentiment tilt made for somewhat rudderless trade.
Looking ahead, bellwether S&P 500 futures are flagging a defensive tone in the final stretch of the trading week. That probably reflects anxiety about escalating US-China tensions after Beijing signed off on a new security law for Hong Kong, which Washington says renders it no longer ‘autonomous’. US President Trump is set to hold a press conference on the matter, and investors are bracing for fireworks.
Oil prices are dutifully tracking lower alongside shares. More of the same looks likely if Mr. Trump moves past rhetoric to announce some kind of punitive action against China. Gold is idling as traders try to reconcile a leading catalyst. Risk-off demand has helped to steady the Greenback but bond yields are retreating, sending mixed messages to bullion. It remains to be seen which influence will prevail.
CRUDE OIL TECHNICAL ANALYSIS
Crude oil prices found resistance above the $34/bbl figure and stalled. Support is in the 27.40-29.11 congestion region. A break below that on a daily closing basis probably exposes the 19.29-20.08 zone (inflection area, 38.2% Fibonacci expansion). Alternatively, establishing a foothold back above the swing high at 34.78 may set the stage for a test at the underside of the December 2018 bottom at 42.40.
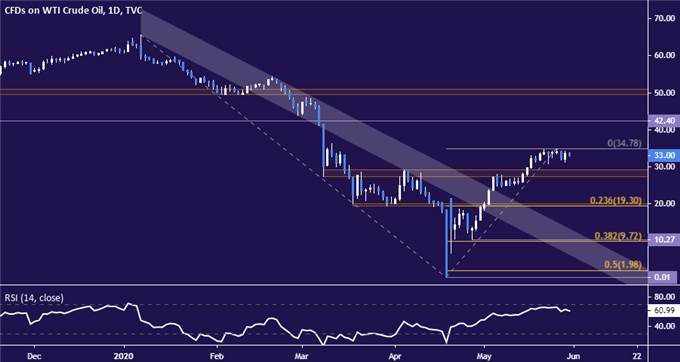
Crude oil price chart created using TradingView
GOLD TECHNICAL ANALYSIS
Gold prices are in digestion mode after slipping below support in the 1715.15-26.24 area. Bearish resumption here sees the next downside barrier at 1679.81, with a daily close below that likely targeting the 38.2% Fibonacci retracement at 1645.40. Alternatively, a move back above 1726.24 probably puts the May swing top at 1765.30 back into focus.
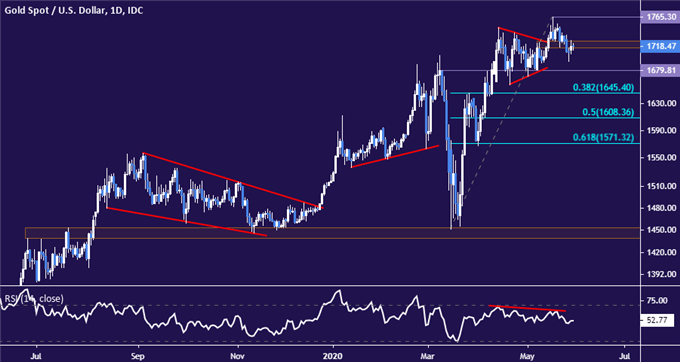
Gold price chart created using TradingView


