
Crude Oil Prices Eyeing OPEC Report As Stocks Rise, Gold Could Gain On The ECB
Crude oil prices aimed higher over the past 24 hours, brushing aside a fairly bearish inventories report from the Department of Energy (DOE). Last week, crude stockpiles surged 13.8 million barrels against expectations of a 0.33 million gain. The surge in supply reflected a combination of refineries struggling to come back online in the Gulf following last month’s winter storm as production in parts of Texas were restored.
The growth-linked commodity seemed to focus on general risk appetite as Wall Street continued to move higher following some recent market volatility. Softer-than-expected core CPI data from the US somewhat cooled underlying inflation expectations, undermining gains seen in longer-term Treasury yields. Anti-fiat gold prices capitalized on this dynamic as the US Dollar weakened.

Image Source: Pexels
Asia Pacific equities were mostly higher on Thursday as futures tracking Wall Street climbed. Investors are likely cheering the impending US$ 1.9 trillion Covid relief fiscal package, due to be signed into law by President Joe Biden ahead. As such, crude oil prices may continue to benefit over the remaining 24 hours. The commodity will also be eying OPEC’s monthly oil report for supply and demand estimates.
However, despite the softer core inflation reading from the US, Treasury yields could yet climb on fiscal stimulus bets. This comes after the Federal Reserve seemed to be sanguine about developments in bond markets. Ahead is also the ECB monetary policy announcement. Gold prices could extend gains if the central bank appears relatively more aggressive about rising longer-term rates in government debt.
Crude Oil Technical Analysis
Crude oil prices continue to consolidate between 64.05 and 66.58, peaks achieved in 2019 and 2020. This area seems to be acting as prominent resistance. Meanwhile, negative RSI divergence does show that upside momentum is fading. This can at times precede a turn lower, placing the focus on the rising trendline from November. The latter may reinstate the dominant upside focus in the event of a short-term pullback.
WTI Crude Oil Daily Chart
(Click on image to enlarge)
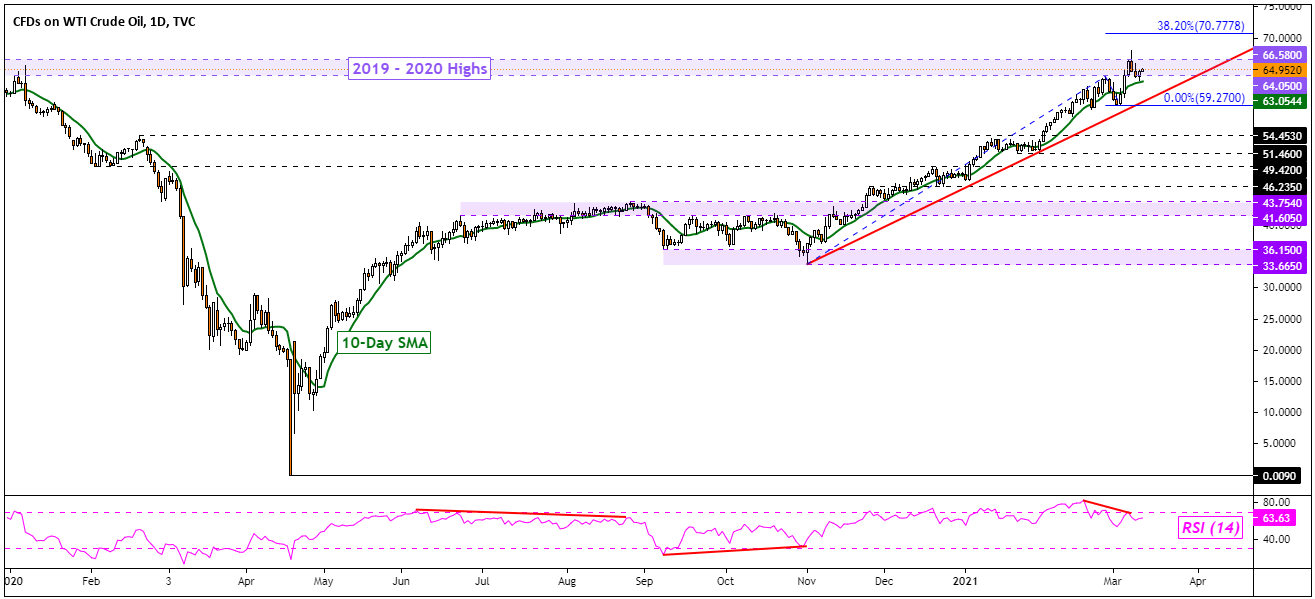
Chart Created Using TradingView
Gold Technical Analysis
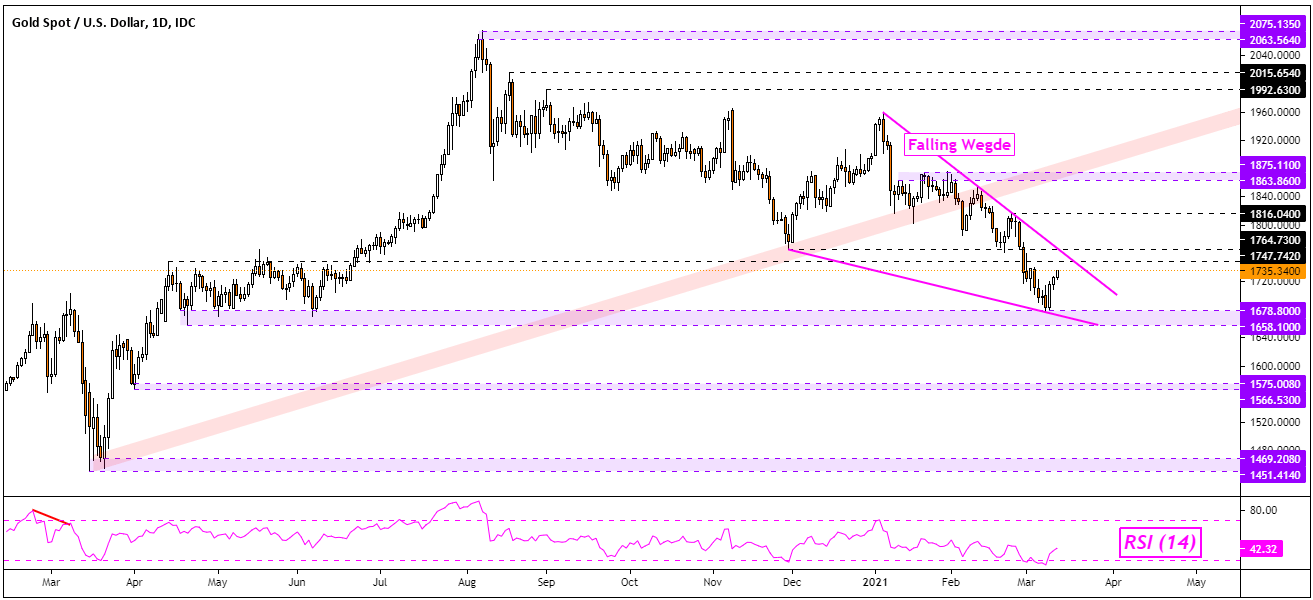
Gold prices recently bounced off the 1658 – 1678 support zone, placing the focus on the ceiling of a bullish ‘Falling Wedge’ chart pattern – see chart below. As such, the 1747 – 1764 range could be a pivotal zone of resistance that has a chance to send XAU/USD lower again. Otherwise, breaking above the wedge opens the door to perhaps reversing what has been the dominant downtrend since August.
Gold Daily Chart
(Click on image to enlarge)
Disclosure: See the full disclosure for DailyFX here.


