
Crude Oil Price Trend May Reverse, API Data And FOMC Minutes Eyed
Crude oil prices rose in a move that the newswires tied to a brighter demand outlook. That’s after reports that passenger traffic at US airports jumped to the highest since March 2020, according to the Transportation Security Administration.
Interestingly, the 5-year Treasury breakeven rate – a measure of medium-term inflation expectations priced into the bond market – rose alongside the WTI contract. Gold prices also tracked higher in tandem, while the US Dollar wilted.
On balance, this speaks to a scenario where swelling demand stokes price growth while the Federal Reserve remains gun-shy about stimulus withdrawal. Whether this narrative finds follow-through this week will probably depend on the contents of April’s FOMC meeting minutes, due Wednesday.

Image Source: Unsplash
Traders will be eager to glean where policymakers draw the line between a “transitory” inflation pickup, a temporary blip owing to base effects (i.e. comparing prices now to the Covid-driven depths of H1, 2020), and something more lasting. This may hint at their willingness to speed up the tightening timeline.
In the meantime, API weekly inventory flow data is in the spotlight. The report will be weighed against forecasts calling for a 1.37-million-barrel build to be reported in official EIA figures mid-week. A lower API print may boost crude prices, while a higher one applies downward pressure.
Crude Oil Technical Analysis
Crude oil prices continue to flirt with the formation of a bearish Double Top chart pattern at resistance in the $66-68/bbl area. Confirming the setup calls for a push through minor support levels in the 60.61-63.53 area to pierce the setup’s neckline at 57.25. A daily close below this boundary would imply a measured move down below the $47/bbl figure thereafter.
Neutralizing near-term selling pressure probably calls for buyers to re-establish a foothold above the $68/bbl handle. From there, the next layers of resistance on the way upward are approximated by the 38.2% Fibonacci expansion at 70.37 and the 50% level at 74.42.
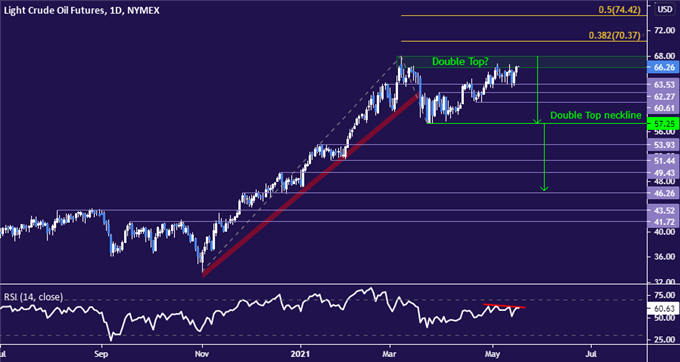
Crude oil price chart created using TradingView
Disclosure: See the full disclosure for DailyFX here.


