Crude Oil Price Gets Caught At Key Resistance: Oil Levels To Know
CRUDE OIL PRICES CATCH SUPPORT AFTER MAY TUMBLE
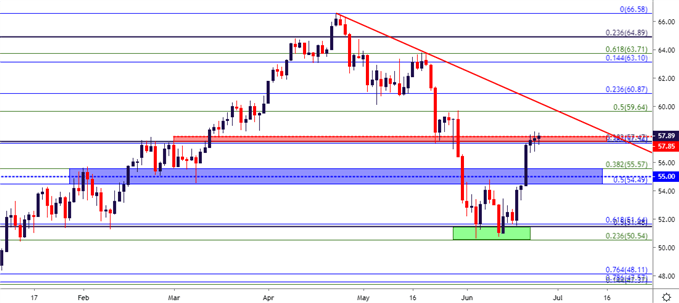
It’s been a riveting two months in Crude Oil markets. While Oil prices had spent much of the prior five months in varying forms of the rally, sellers showed-up in late-April and continued to drive price action through the month of May. As looked at coming into June, which bearish breakout potential permeated the backdrop and in the early portion of the month, prices plummeted down to a fresh four-month-lows, soon finding support at a key area on the chart around the 50.54-51.50 zone, which contains a few different Fibonacci levels of relevance.
CRUDE OIL PRICE DAILY CHART

Chart prepared by James Stanley
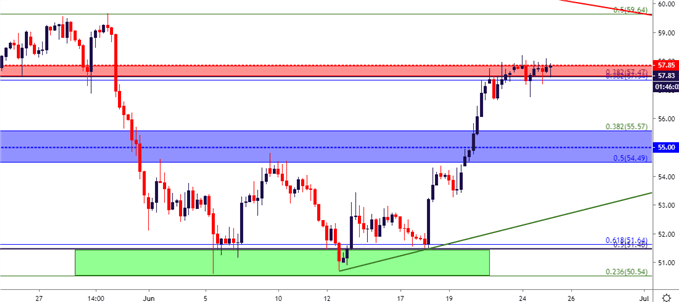
After support came into play during the first week of June, a bit of digestion began to show. This lasted for a little over a week as prices initially flickered up to the 54.59 Fibonacci level, after which buyers came-in to pose a higher-low on the chart. That support held into last week, at which point a strong rally began to show on the back of the FOMC rate decision on Wednesday. With the Fed posing a dovish twist in their forecasts, pretty much anything not nailed down has seen prices gain.
In Crude Oil, this has amounted to a rally back to a key zone on the chart, and this is an area that had previously come into play as support in late-May as prices were breaking down. This area held the highs on Friday and through the weekly open, and after a doji yesterday sellers are continuing to hold the advance at bay.
CRUDE OIL FOUR-HOUR PRICE CHART

Chart prepared by James Stanley
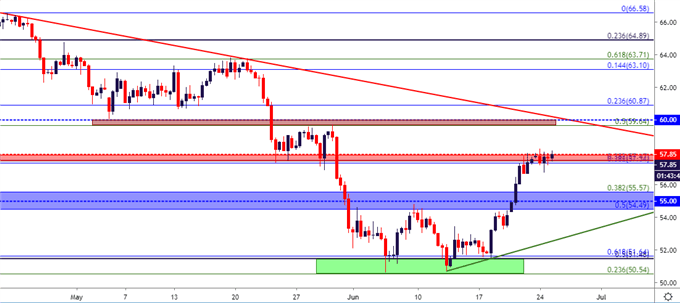
Given the equalized price action that’s been showing since Friday, and this market can break in either way. Given the brute force of the selling that initially drove the move in late-April, May and early-June, there could be a bit more unwind to show before sellers might be able to come back into the picture. For that, resistance around the 60-level could remain as attractive, as this level is confluent with the 50% marker of the October-December sell-off, and this is the same study from which the 23.6% marker helped to catch the low earlier this month. There’s also a bearish trend-line projection in the same area, taken from April and May swing-highs.
CRUDE OIL EIGHT-HOUR PRICE CHART

Chart prepared by James Stanley
CRUDE OIL REVERSAL PLAYS
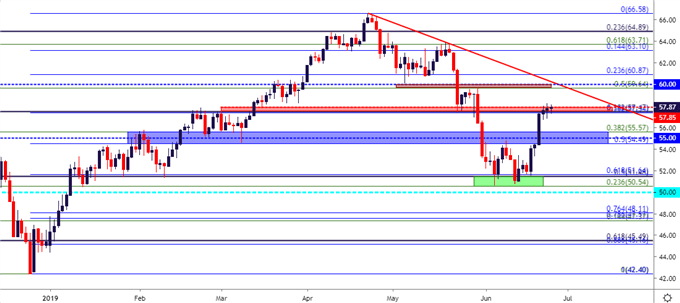
Given the hold of resistance, there could also be near-term reversal potential. Given the hold in this resistance zone, traders would likely want to keep risk levels rather tight so that if a topside push up to 60 did develop, reversals could simply be opened at a higher price later without having to take a ride up to a near-term higher-high. Monday’s swing low can function as a nearby target that could allow for break-even stop moves, while the Fibonacci level lurking below at 55.57 can function as an initial target in the move. Below that, the levels of 55.00 and 54.49 retain interest as well; and if sellers can really make a mark, potential support around 53.25 and 52.50 remain of interest. After that, the prior zone of support comes into play at 51.50 and then 50.54, which then exposes the psychological level of 50.
CRUDE OIL PRICE CHART FOUR HOURS

Chart prepared by James Stanley


