Crude Oil Outlook: Bulls & Bears Clashing At Key Support
Crude oil price action dropped -1% during Tuesday’s trading session and closed back below its 100-day simple moving average. This marks the fourth consecutive decline for the commodity as markets grow increasingly weary over weak economic data and slowing global growth. Trader sentiment has started to deteriorate more broadly too with major stock indices like the Dow and Nasdaq starting to come under pressure as well. Risk aversion is similarly being reflected by the S&P 500-derived VIX Index, or fear-gauge, which has risen sharply over the last two sessions.
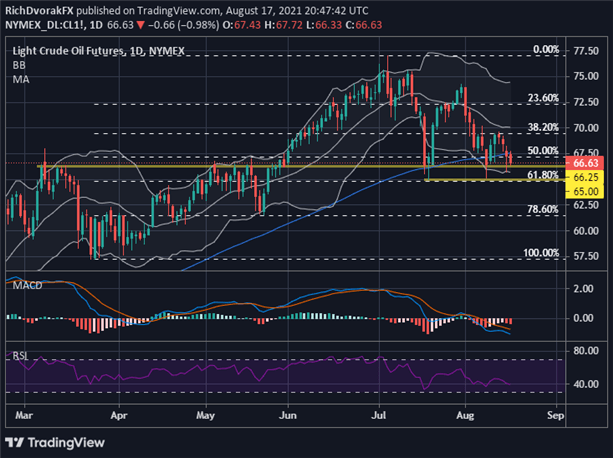
CRUDE OIL PRICE CHART: DAILY TIME FRAME (23 FEB TO 17 AUG 2021)

Chart by @RichDvorakFX created using TradingView
Oil prices now hover back around a critical area of technical support between $65.00-66.25/bbl. That said, lower highs formed over recent weeks has exerted downward pressure on this key support zone to an increasing degree. As such, maintaining buoyancy near current levels and reclaiming the 100-day simple moving average remains paramount for crude oil bulls to keep the broader uptrend intact.
A breakdown of this support zone – underpinned by prior resistance from the 05 March high, the 20 July swing low, bottom Bollinger Band, and 61.8% Fibonacci retracement level of the latest bullish leg – would thus likely prime crude oil for an extended drop into bear market territory. That could see crude oil prices sink toward the 78.6% Fibo and mid-May lows as subsequent support. Conversely, another defense by crude oil bulls around the $65.00-66.25 level might see the commodity recoil higher to have another look at the $70.00-handle and 20-day simple moving average.
Disclosure: See the full disclosure for DailyFX here.


