Crude Oil, Gold Prices May Fall On Fed Chair Powell Testimony
Crude oil prices plunged after US President Donald Trump took to Twitter to talk OPEC out of raising prices further, saying they are “getting too high” and asking the cartel to “take it easy”. He ominously added: “[The] world cannot take a price hike – fragile!”
Besides stoking global slowdown fears, Mr. Trump may be giving OPEC too much credit. As it happens, crude prices fell nearly 19 percent in the two weeks after it and other like-minded producers including Russia (the so-called “OPEC+” group) issued the latest coordinated production cut in early December 2018.
The subsequent rise has tracked the recovery in stocks, and so seems to owe to a broader recovery in risk appetite rather than OPEC’s influence. Still, the markets can hardly be expected to ignore an attempt to talk down prices by the leader of what is – as of 2018 – the largest oil-producing nation in the world.
Gold prices were little-changed, treading water, curiously unable to find meaningful support despite falling Treasury bond yields and a weaker US Dollar. Those moves might’ve been expected to boost the relative appeal of anti-fiat and non-interest-bearing assets, but this clearly didn’t happen this time.
FED CHAIR POWELL TESTIMONY MAY HURT COMMODITY PRICES
From here, the spotlight turns Fed Chair Jerome Powell as he begins two days of semi-annual testimony in the US Congress. He is due at the Senate today and then sit for a repeat performance in the House of Representatives on Wednesday.
Last week, minutes from January’s FOMC meeting offered a “wait-and-see” tone that clashed with the markets’ more overtly dovish disposition, lifting the US Dollar and hurting gold. Similar rhetoric from Mr. Powell may produce analogous results.
In fact, the metal’s reticence to commit to a direction yesterday may well reflect worries about just such a possibility. Traders were perhaps unwilling to bet with gusto on the long side despite seemingly supportive market conditions, opting to wait for the Fed Chair to speak first.
Crude oil may also suffer if a stronger Powell lifts the Greenback, succumbing to de-facto selling pressure alongside other USD-denominated assets. Separately, API inventory flow data will be sized up relative to expectations calling for a 2.51-million-barrel build to be reported in official EIA figures Wednesday.
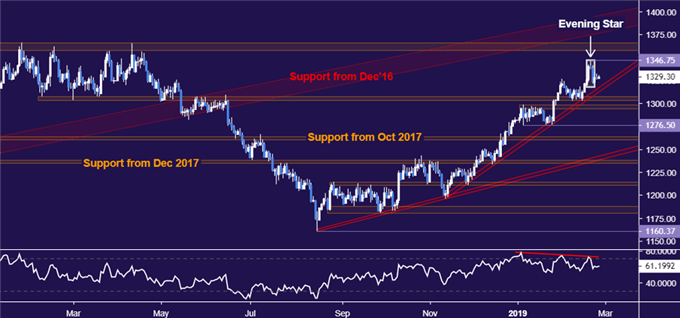
GOLD TECHNICAL ANALYSIS
Gold prices continue to hover above support underpinning the uptrend from mid-November. A bearish Evening Star candlestick pattern coupled with negative RSI divergence continues to warn of topping. Confirmation of reversal on daily close below 1249.10 initially targets 1276.50. Alternatively, a push above the February 20 high at 1346.75 exposes the pivotal 1357.50-66.06 area.
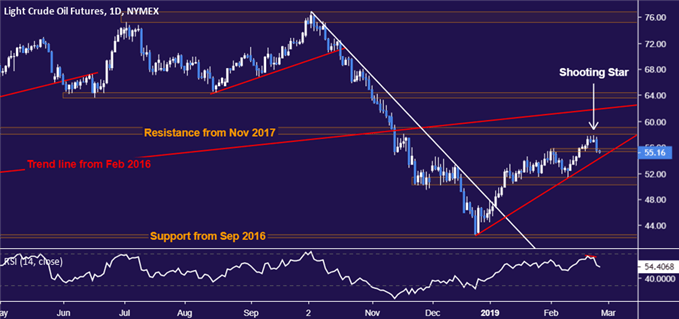
CRUDE OIL TECHNICAL ANALYSIS
Crude oil prices turned lower as expected, with sellers now probing support in the 55.37-75 area. This is reinforced by a rising trend line set from late December, now at 54.39. A daily close below the latter level would suggest the longer-term downtrend has resumed, initially exposing the 50.15-51.33 zone. Alternatively, a push above resistance in the 57.96-59.05 region aims for trend line support-turned-resistance set from February 2016, currently at 61.90.