
Crude Oil Elliott Wave Analysis – Minimum 3 Waves Fall Ahead
On Wednesday Russia’s president, Vladimir Putin said his country was prepared to stabilize the rising global energy prices that are threatening the economy. So this can be one of the reasons for lower crude which is in a sharp fall. We have been warning about this retracement which is likely going to be deeper as we see only one leg of a minimum three-wave drop. As such, any intraday rallies can be limited.

Image Source: Unsplash
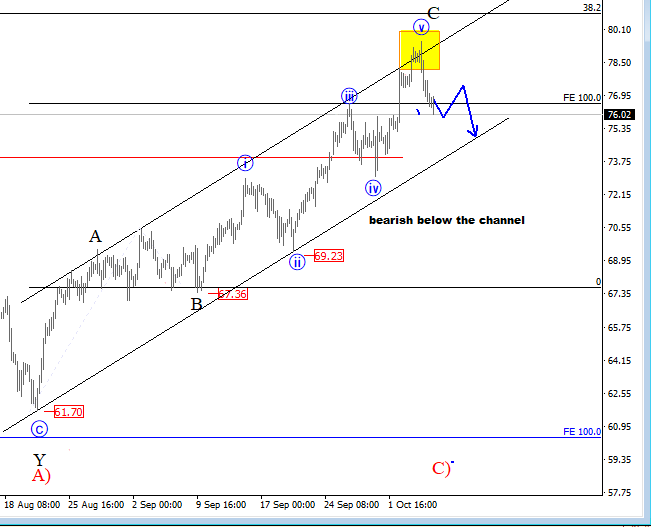
On 4h chart Crude oil is coming nicely to the downside about we have been warning in the past updates when we noticed five waves up from $67.36, either as wave 3 or even wave C. In both cases, we anticipate three waves of a retracement minimum which can take the market back to 72-74 area, even if that will be wave 4 later.
Crude Oil 4h Elliott Wave Analysis Chart
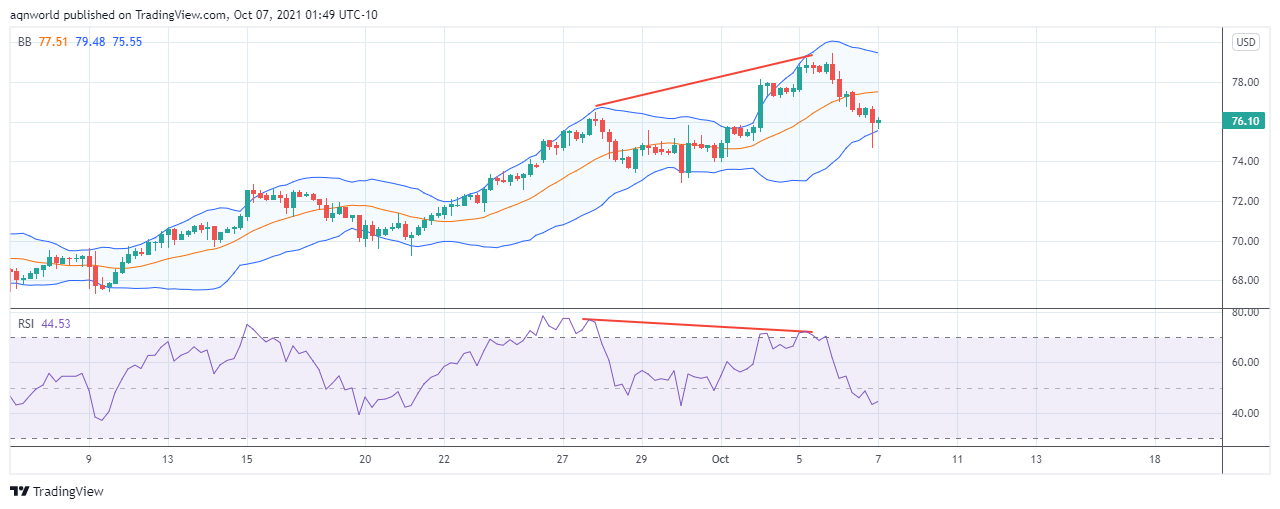
Technically crude oil slid from upper Bollinger band to lower Bollinger band and RSI is oscillating below 50 level just after that RSI has formed bearish divergence on 4h chart, looks like bear are active in the game and taking control further.
Crude oIL 4h Chart
(Click on image to enlarge)
Disclosure: Please be informed that information we provide is NOT a trading recommendation or investment advice. All of our work is for educational purposes only.


