
Crude Oil, Bitcoin (BTC) & AMC Rollercoaster – FinTwit Trends To Watch
U.S. CRUDE OIL (WTI) TRADING AT YEARLY HIGHS LAST SEEN IN 2018!
Upbeat U.S. PMI figures bolstered crude oil prices this week showing a prosperous manufacturing performance for the month of May. Both ISM and IHS Markit data estimates were exceeded further illustrating the sectors strength.
Although the Organization of the Petroleum Exporting Countries (OPEC) concluded that they will slowly reduce restrictions on production cuts going forward, price action continues to soar. All eyes will be on Iran around the much anticipated nuclear deal negotiations which will likely see a significant impact on the crude oil market as talks are underway in Vienna.
U.S. crude oil (WTI) daily chart:
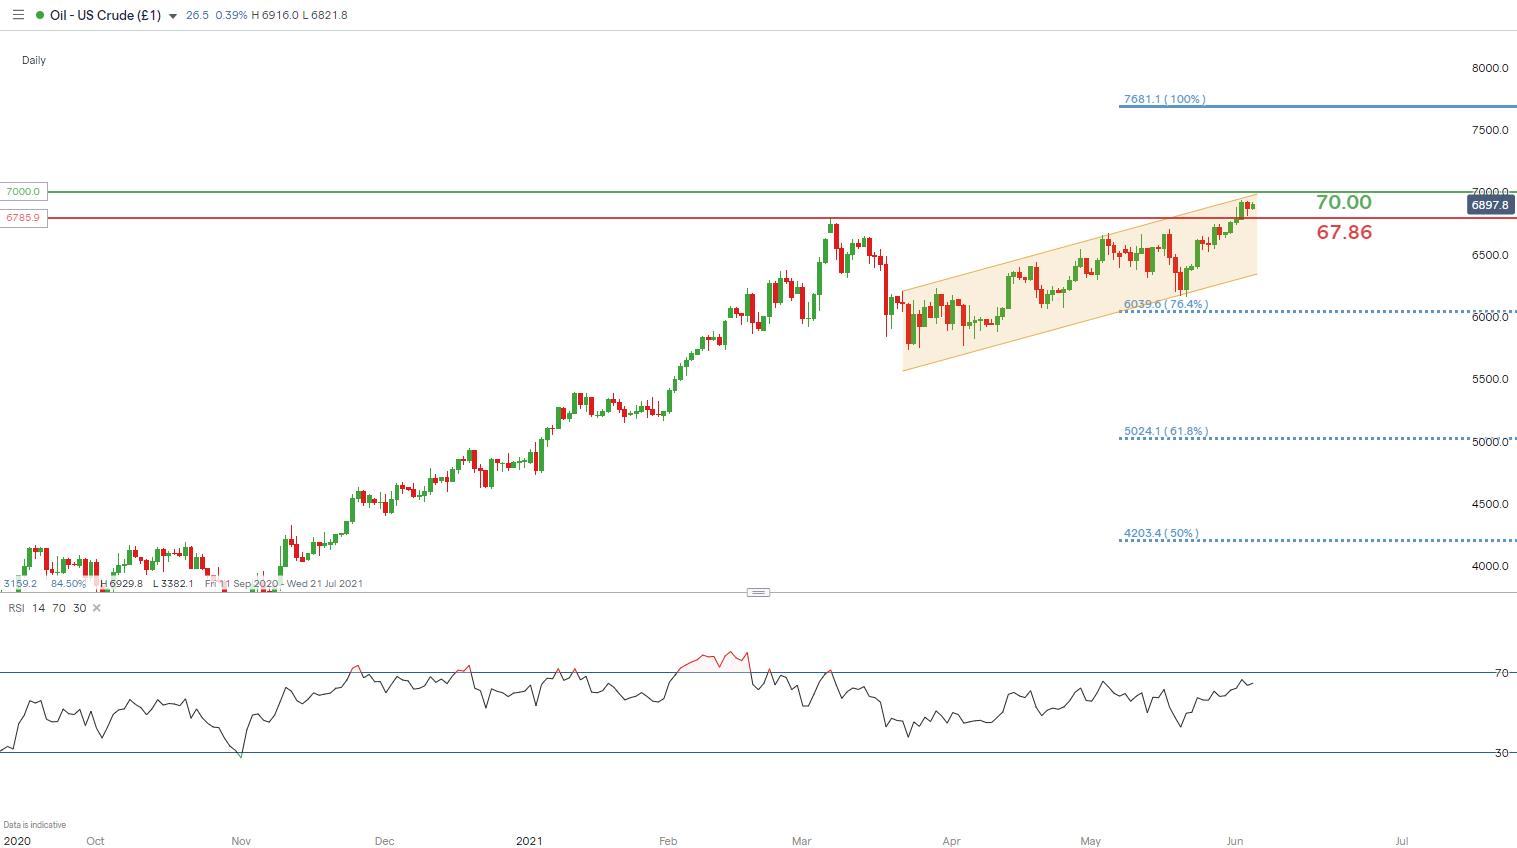
Chart prepared by Warren Venketas, IG
On the technical side, U.S. crude remains within the ascending channel (yellow) which is slowly approaching the key psychological $70.00 per barrel level.
ELON MUSK DISRUPTS BITCOIN (BTC/USD) RALLY
This week Elon Musk was back at it on Twitter with suggestive Tweets about a potential ‘break-up’ between himself and Bitcoin. BTC slipped roughly 5% on Friday wiping out much of the weeks' gains. This had a contagion effect across the broader cryptocurrency market with the second-largest crypto Ether down 6.5% (at the time of writing). It is likely this cat and mouse game between Elon Musk and the cryptocurrency market will persevere until such time as Bitcoin satisfies the billionaire's exacting demands. Regulation of market influencers may also curb the impact of Mr. Musk but for now, these seem a long way away.
Bitcoin (BTC/USD) daily chart:
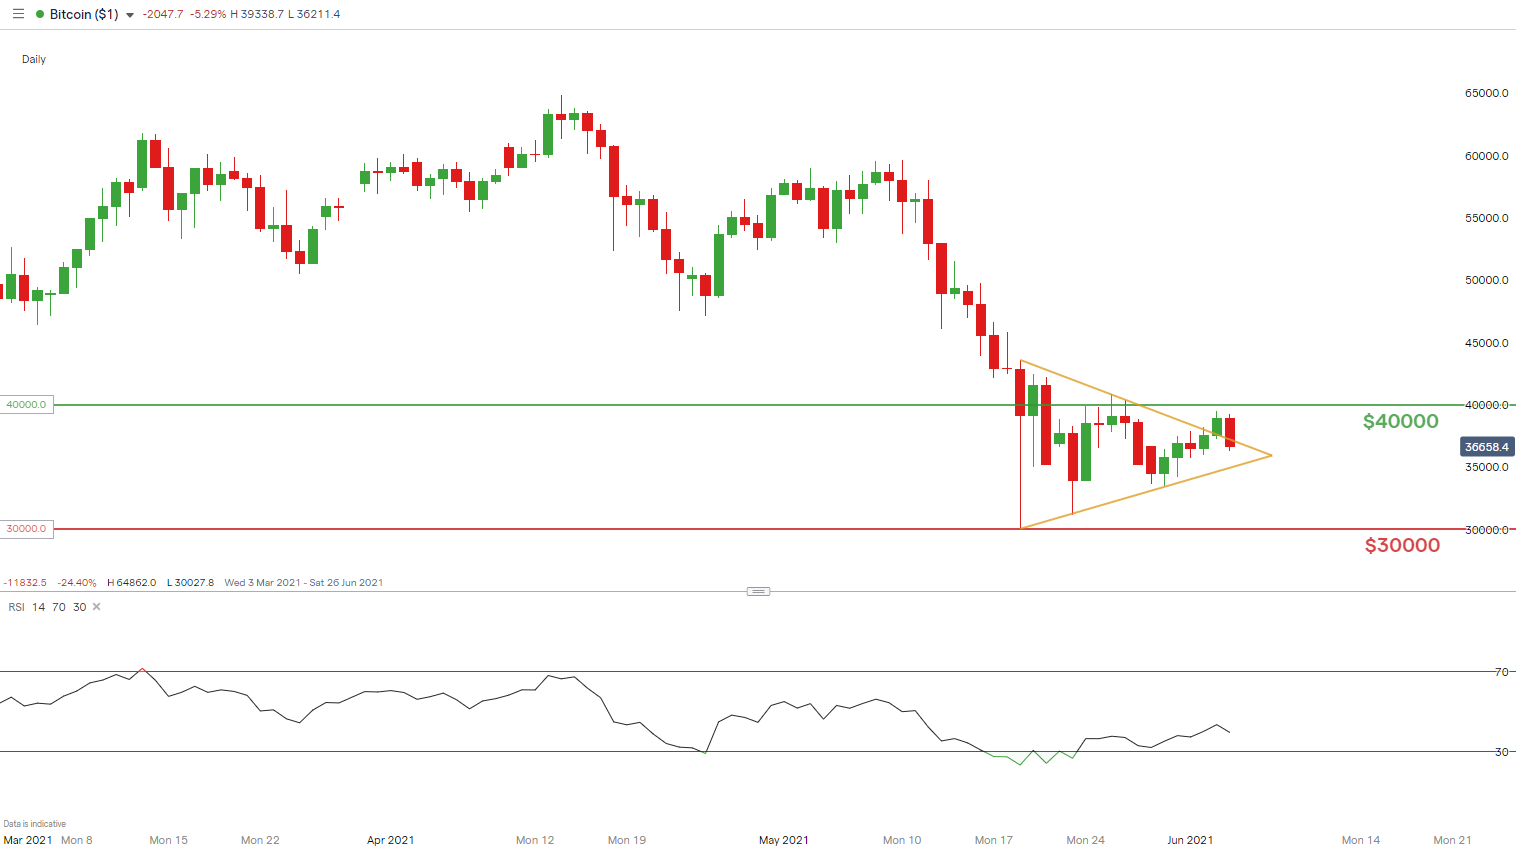
Chart prepared by Warren Venketas, IG
The daily Bitcoin chart broke out of the symmetrical triangle pattern (yellow) on Thursday with a candle close above triangle resistance. Traditionally, a break above or below may indicate further extension of that respective break but in this case, today's candle has pushed prices back into the triangle for now. It will be interesting to see how the day finishes off, with a close above triangle resistance potentially setting up the weekend for additional upside.
AMC SHORT SQUEEZE 2.0: THE ROLLERCOASTER RIDE CONTINUES
The well-known meme stock is back at it again, registering unprecedented levels of implied volatility derived by the options market. A lot has happened this week but the signs of another attempt to push the stock price higher appeared towards the end of last week as short interest in the stock rose well above the recent average.
The top half of the chart below shows the rise in the number of shares shorted, which accelerated rather aggressively. This didn’t go without notice as a similar rise in price followed.
AMC Diagram: AMC short interest and price response
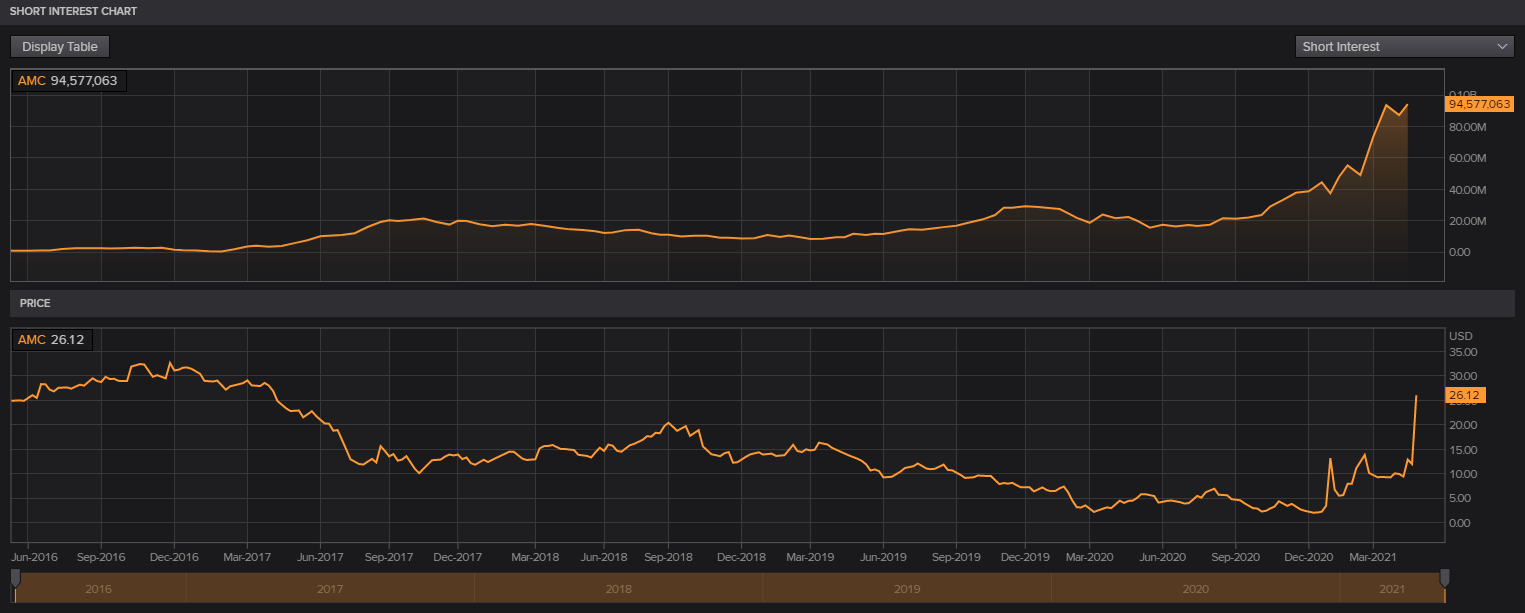
Source: Refinitiv Datastream
However, the biggest moves in price were experienced on Wednesday and Thursday this week as AMC decided to cash in on $230.5 million worth of shares which it sold to New York-based Mudrick Capital Management LP. Retail sentiment rose on the back of this announcement pushing the share to its highest level of around $72.62.
In true meme stock style, the exponential rise was followed by a drastic sell-off on Thursday as the AMC filed to sell 11.5 million shares of its stock. Adding further fuel to the fire, the company also warned investors that the current share price is not reflective of the business's fundamental value, adding that investors stand to risk all of their money in the current, highly volatile period.
AMC 2 hour chart
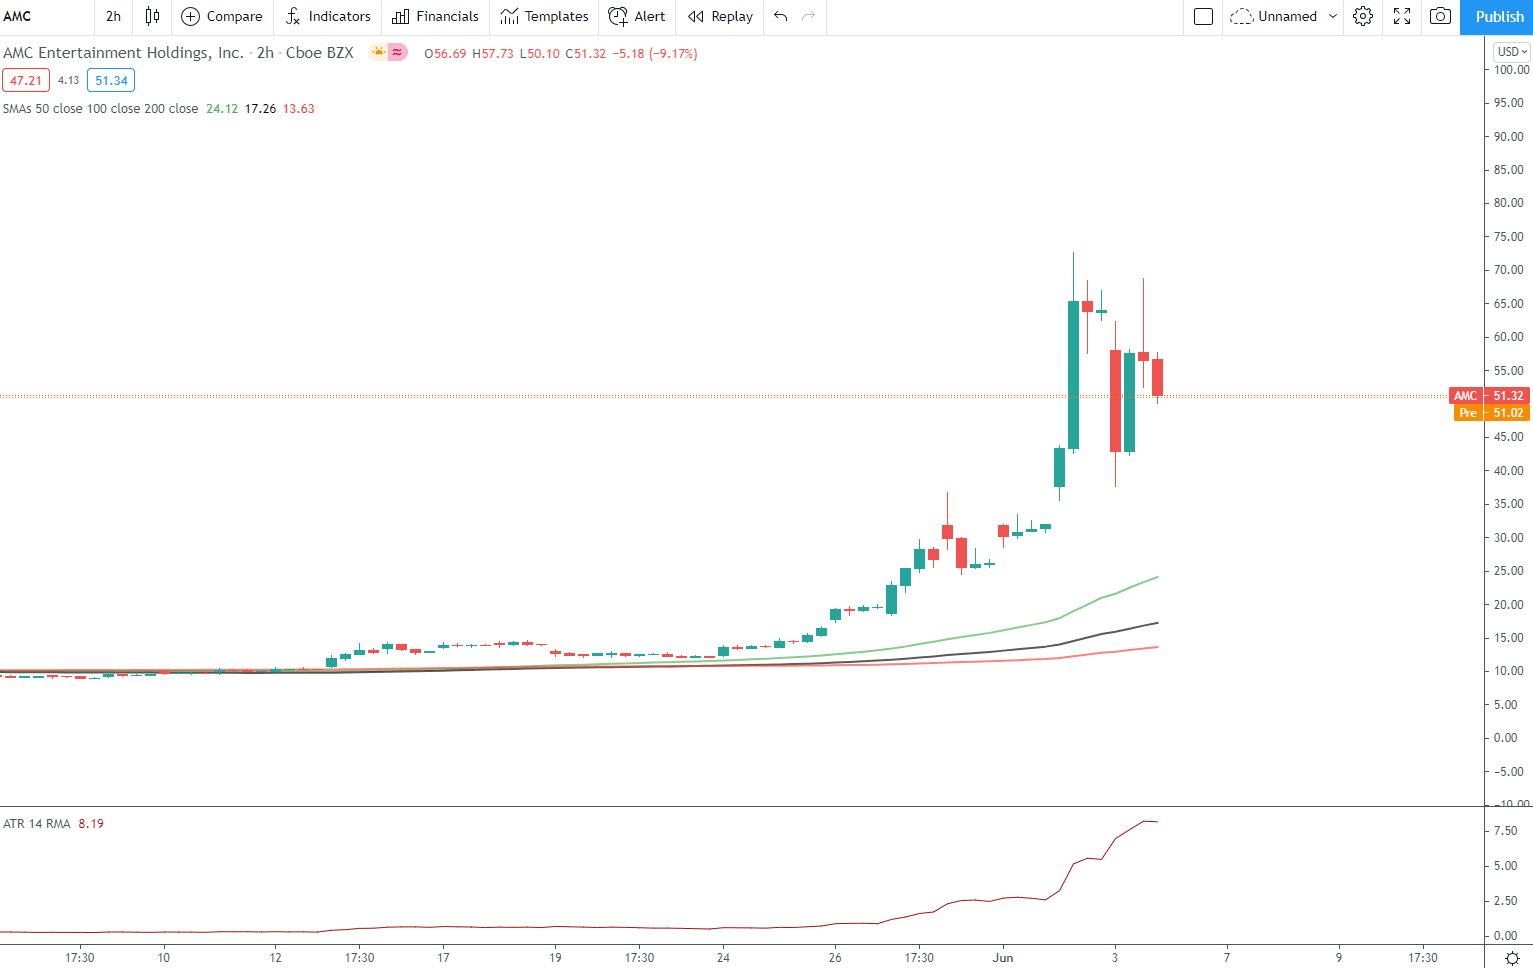
Source: TradingView
Disclosure: See the full disclosure for DailyFX here.


