
Coronavirus Makes Market History
Thursday’s fall in equity markets was the worst since the October 19, 1987 stock market crash. I was a young interest rate trader then, and that evening I warned my wife that we should stock up on canned food while we prepared for another 1930's Depression. She scoffed that only Wall Street had a problem, and that Main Street was fine.
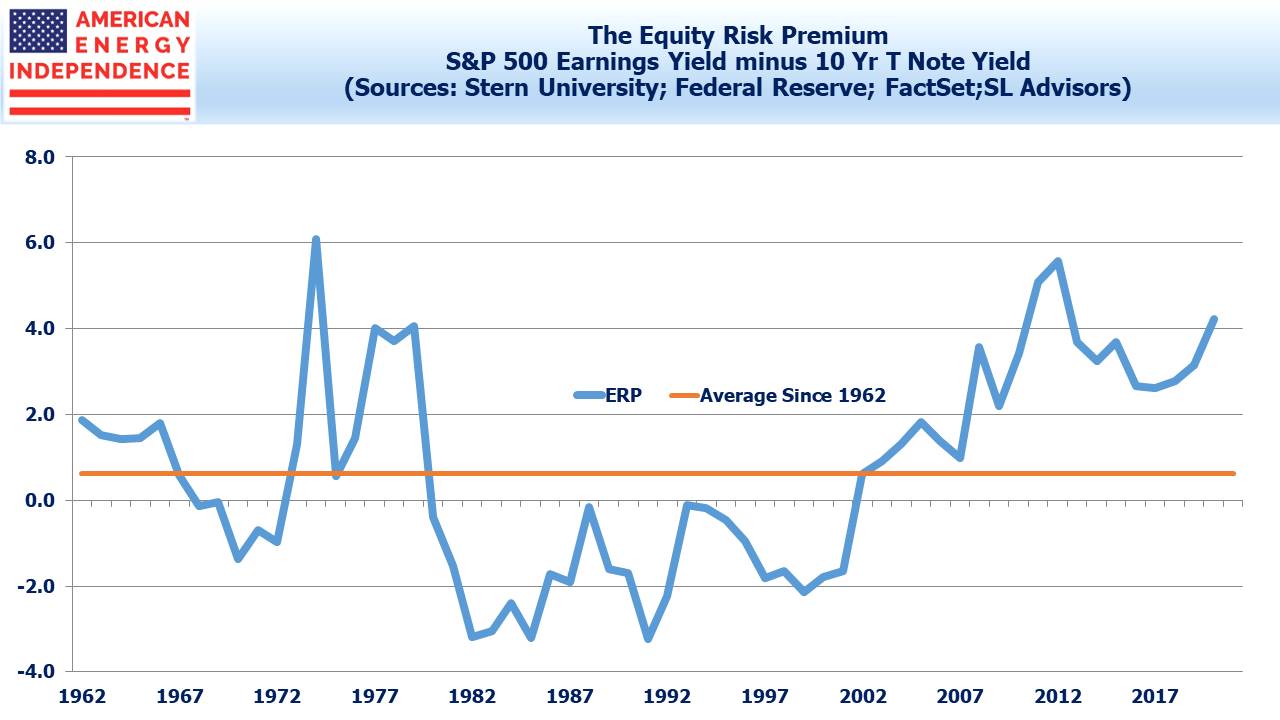
1987, 2008 and today have different causes, but the need for some solid valuation guideposts is the same. The Equity Risk Premium (ERP) is the difference between the S&P 500’s Earnings Per Share (EPS) yield (inverse of the P/E) and ten-year treasury yields. Assuming, EPS drop 15%, the ERP is showing stocks to be attractive. A 15% drop seems conservative, and would be approximately the same as 2008, but we’ll emerge from this crisis into a different world. Based on what we know today, broad equity exposure looks cheap.
Energy sector investors have endured several years of underperformance. The industry has invested more in exploiting the Shale Revolution than investors wanted. Crude oil has been hit by the COVID-19 demand shock, collapse of OPEC+ and Saudi Arabia’s subsequent decision to increase supply into an over-supplied market.
Domestic energy demand will drop, but it will eventually recover. The upstream companies that drill for oil are at the epicenter of the price collapse. Midstream energy infrastructure companies care about the financial health of their customers as well as the volumes flowing through the system. The sector entered this downturn with stronger balance sheets than in 2014 and with developing a very positive free cash flow story (see Updating the Coming Pipeline Cash Gusher).
We expect most to follow Oneok (OKE) in cutting spending on growth projects this year, which will free up cash to further reduce debt. The American Energy Independence Index consists of 75% investment grade companies doing about 80% of their business with investment grade customers. The index is down around 50% YTD, roughly the same as U.S. airline stocks, which are regarded as needing some type of short term Federal government support.
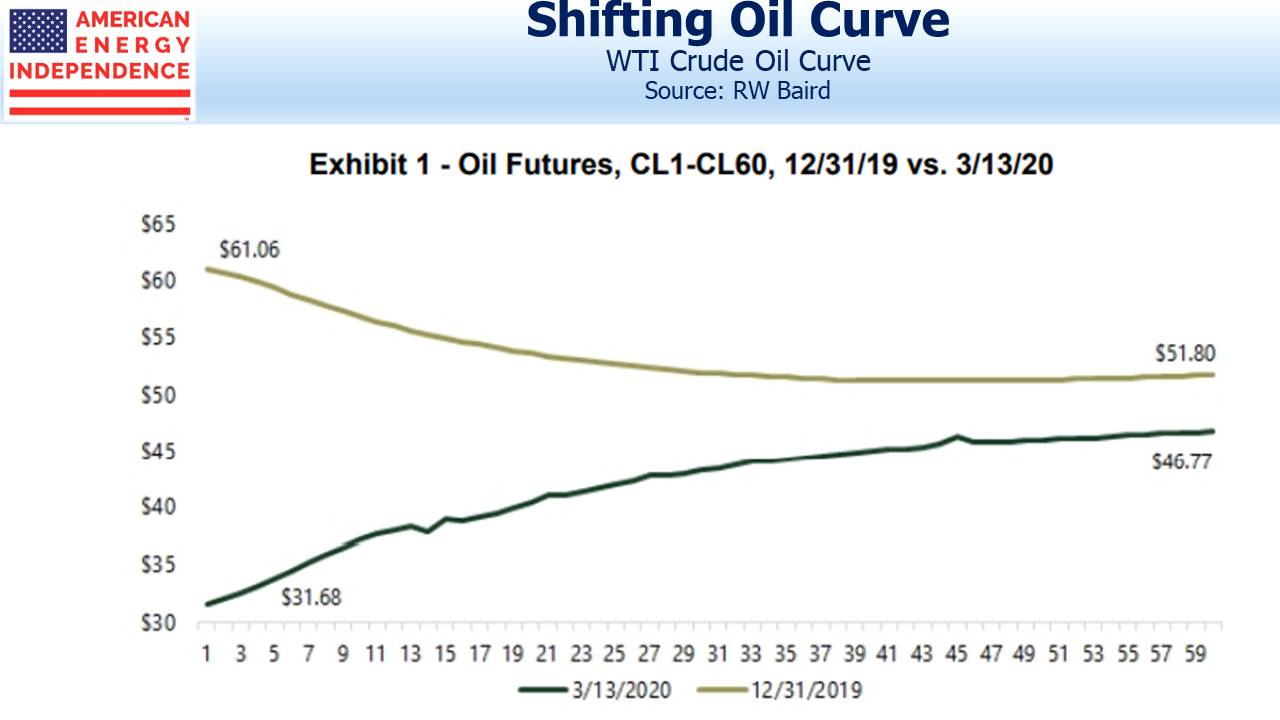
Finally, an interesting chart from Ethan Bellamy at RW Baird, which illustrates the shift in the crude oil curve over the past three months. Spot prices have moved much more that deferred futures contracts. Saudi Arabia and Russia are generally sellers into the spot market, while shale drillers tend to hedge future output for the next couple of years. Because the curve is in contango, sales in the spot market have the lowest realizations.
A strategy to damage the shale industry would create backwardation, as existed in December. In that environment, forward sales of output realize lower prices than spot, which is good for big producers like Saudi Arabia. Their goal is to drive down futures prices along the curve, and the chart shows that spot prices have dropped $30 to produce a far smaller change at, say, the 36-month point. It’s a very expensive strategy for the sellers. At least the Strategic Petroleum Reserve is being replenished cheaply.
Energy had the worst week any of us can recall, and few readers probably have much appetite for a bullish view. For investors and asset managers in the sector, Friday’s rally was welcome but well short of compensating for prior losses. So we’ll just let the chart speak for itself.
The information provided is for informational purposes only and investors should determine for themselves whether a particular service or product is suitable for their investment needs. Graphs and ...
more

