
Coronavirus 2020 And Gold
SARS Helped Pump Up the Price of Gold
One way to attempt to predict the future is to look to the past for similar analogies. For the recent coronavirus outbreak, a similar analogy might be the SARS outbreak of 2002. SARS might tell us something about how a pandemic might affect the price of gold.
Let's see where the VC PMI is identifying that gold could reach if this pandemic intensifies. I believe that the coronavirus (2019-nCoV) is much worse than we are hearing from the government of China or the media is telling us. Begin with the political pressure around the death of the Chinese doctor, Li Wenliang, who was the first to warn about the virus and its potential to spread.
Nevertheless, the market has been reacting almost complacently with regards to the potential danger that appears to be unfolding on a global scale, which essentially could freeze any world economic growth. It could stop or seriously hinder trade and travel as well as any impetus to generate any economic recovery. This an unexpected black swan, and as we find out more, we are probably going to learn that it's much worse than the government agencies are telling us, especially the Chinese government, which at first attempted to minimize the degree of the threat. With that in mind, I want to use this as an introduction to how it might affect the price of gold as we come into next week.
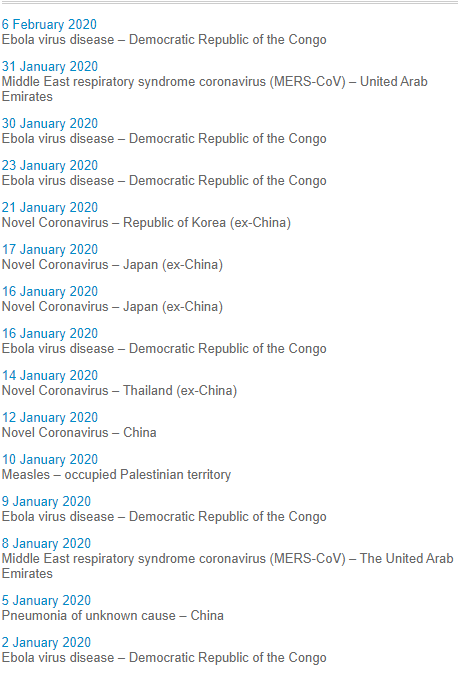
On Jan. 30, 2020, following the advice of the Emergency Committee, the WHO Director-General declared the outbreak of novel coronavirus (2019-nCoV) a Public Health Emergency of International Concern. In China, more than 7,700 cases have been confirmed, and 170 people have died. There are 82 additional cases confirmed in 18 countries.
Emergencies preparedness, response
SARS coronavirus (SARS-CoV) was virus identified in 2003. SARS-CoV is thought to be an animal virus from an as-yet-uncertain animal reservoir, perhaps bats, that spread to other animals (civet cats) and first infected humans in the Guangdong province of southern China in 2002.
Transmission
An epidemic of SARS affected 26 countries and resulted in more than 8,000 cases in 2003. Since then, a small number of cases have occurred as a result of laboratory accidents or, possibly, through animal-to-human transmission (Guangdong, China).
Transmission of SARS-CoV is primarily from person to person. It appears to have occurred mainly during the second week of illness, which corresponds to the peak of virus excretion in respiratory secretions and stool, and when cases with severe disease start to deteriorate clinically. Most cases of human-to-human transmission occurred in the healthcare setting, in the absence of adequate infection control precautions. Implementation of appropriate infection control practices brought the global outbreak to an end.
Geographical Distribution
The distribution is based on the 2002-2003 epidemic. The disease appeared in November 2002 in the Guangdong province of southern China. This area is considered as a potential zone of re-emergence of SARS-CoV.
Other countries/areas in which chains of human-to-human transmission occurred after early importation of cases were Toronto in Canada, Hong Kong Special Administrative Region of China, Chinese Taipei, Singapore, and Hanoi in Vietnam.
What Happened to Gold Since 2002?
(Click on image to enlarge)
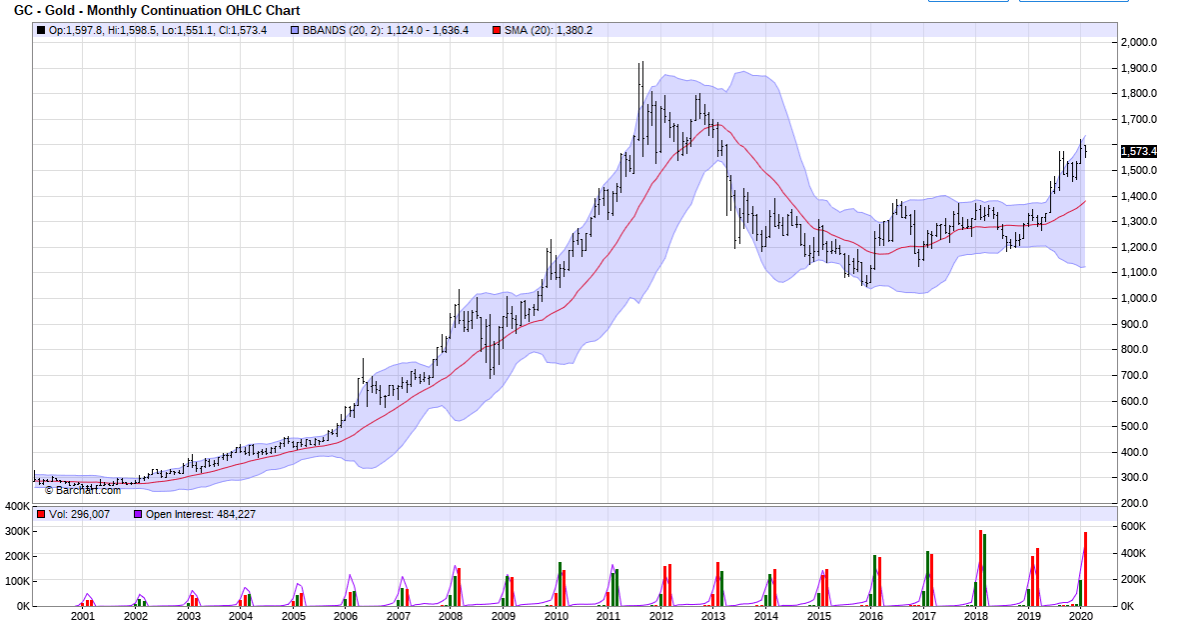
In February 2002, gold was trading at $297.10. It closed above the 20-day moving average of $278. The close above activated a bullish trend momentum. The SARS virus appeared in November 2002 in the Guangdong province of China. Gold moved up to about $417 an ounce. After the announcement of SARS, gold shot up more than $100 an ounce. Gold continued to trade consistently above the 20-day moving average all the way until September 2011 to make a high of $1,925. Although the pandemic scare of SARS in 2002-2003 may not have been the underlying, exclusive cause of this bullish uptrend in gold, it certainly provided an incredible trading opportunity short term, with the market rising more than $100 an ounce.
If you look at the high that was made in 2011, the market then came down into January 2013, closing below the 20-day moving average of $1,675. It then activated a long-term bearish trend. The close was $1,662 in January 2013. Since then the price made what looks to be a rounding saucer bottom low in 2015 at $1,116. That seems to be the ultimate low, from which we are now making the next leg up. The breakout through the 20-day moving average happened in April 2019 by closing above $1,515. We have seen a steady rise in the market to a recent high of $1,598.50 in January 2020. The market has reverted back from this area, which is being identified by the Variable Changing Price Momentum Indicator (VC PMI), so let's look forward.
Coronavirus 2020 and Gold
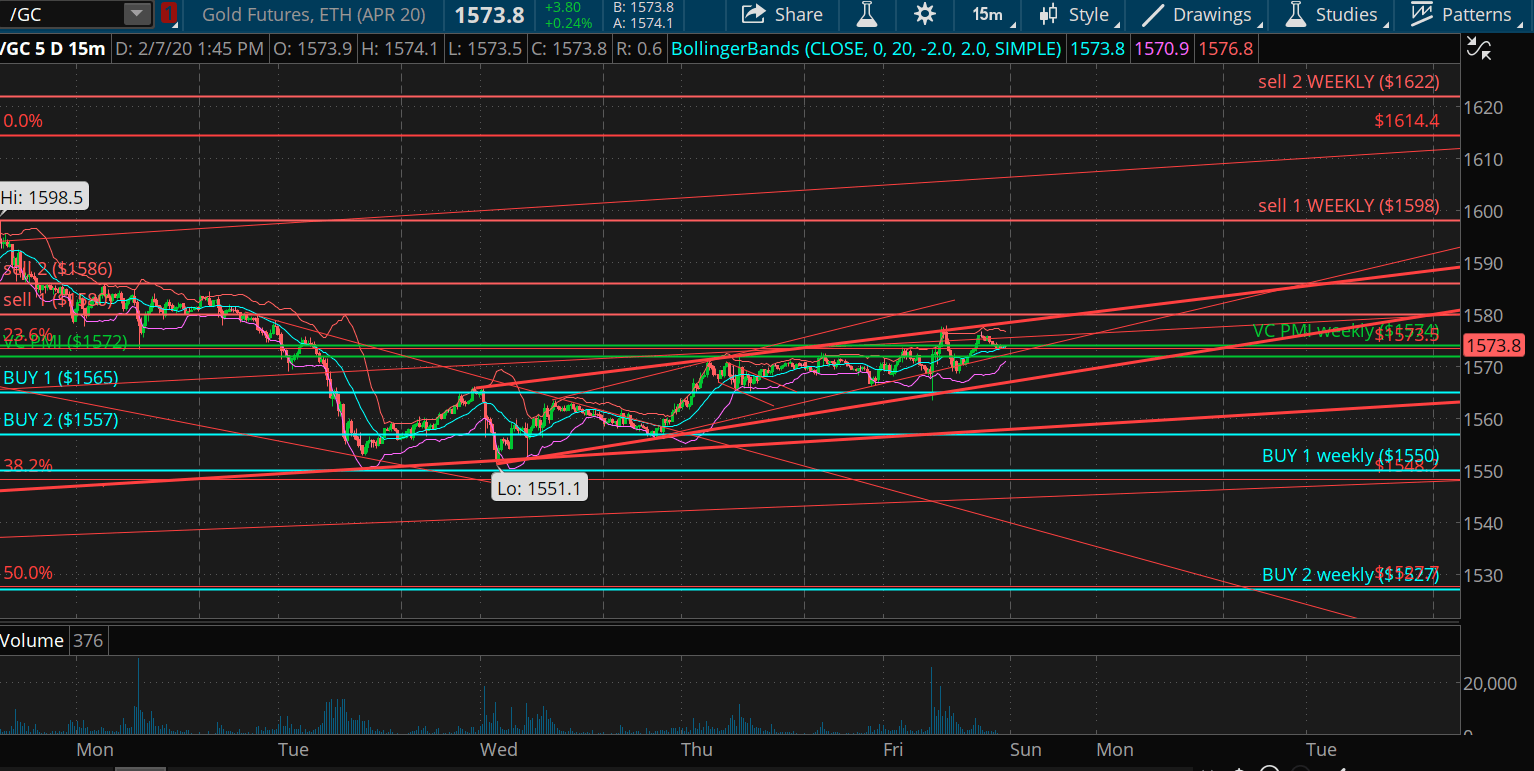
We have been tracking almost exclusively the gold market because it has been giving us tremendous opportunities. Our proprietary Variable Changing Price Momentum Indicator (VC PMI) has been giving us excellent day, swing and even long-term trading opportunities.
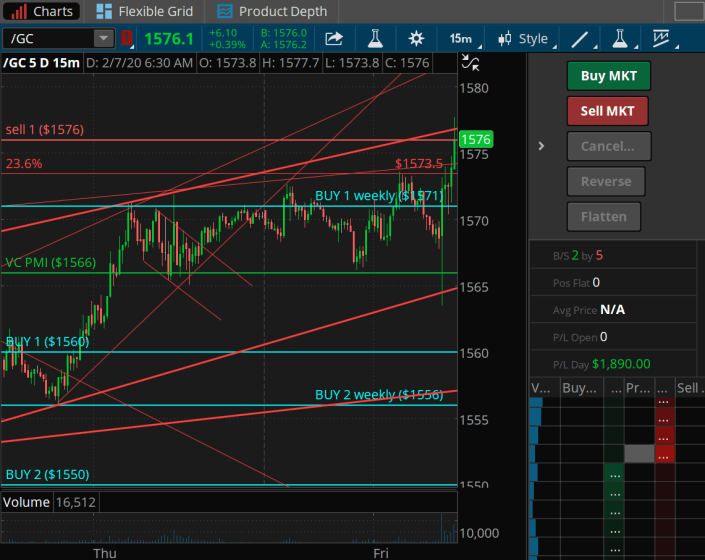
Courtesy: TDAmeritrade
As the chart shows, gold is trading last at $1,576.10, up about $6.10. We already have made about $1,890 in day trading the market from the extreme, with the market coming down. The daily average is $1,566 according to the VC PMI. The market has activated a weekly buy signal by closing above $1,571, even with this huge bar down early this morning. Someone either puked or got stopped out, and massive selling came in. The price came down right into this trend line of support that we have been building in this lower area of $1,551. We anticipated that level this past Saturday in our report on Seeking Alpha when we were looking for $1,550, and the low was $1,551.10. We have been up-trending, and we seem to be breaking out of the Sell 1 daily signal level of $1,566. The market has completed a 23.6% Fibonacci retracement at $1,573.50. We are at the upper end of this uptrend channel in the $1,576 area. If we are able to go through this, the second daily target will be activated at $1,582 and the VC PMI weekly signal target of the mean at $1,584 will be the target we are looking for.
I don't use or trade on fundamentals usually because, by the time the price accomplishes these targets, the market will have taken into account the majority of the fundamentals. We follow a scientific algorithmic concept called the reversion to the mean. The algorithm identifies the daily, weekly or monthly average price. In this case, the average daily price of $1,566 has been pretty well supported. The extreme below that average price has identified buyers. The area in blue represents accumulation of supply or an oversold condition. The algorithm identifies the trigger point when the market touches the price level and, in this case, the market then reverted back toward the mean.
The synergy between the daily and weekly numbers means that we have a harmonic convergence, which is a powerful sign that the market is going to revert back toward the mean. The Buy 1 level has a 90% probability that if the market goes through that number, it will revert back to the mean. The weekly Buy 2 level at $1,556, it's a strong indication that the market is ready to revert. Gold then closed above the daily signal before coming back down to test those buyers underneath. From $1,556 we are looking for the mean to be reached at $1,566, but also for the final target on the weekly average price of $1,594. It may not occur today, but whatever happens, we are in an up-mode. My stop is on a close below $1,571. We've met the daily target of $1,576. We have made $1,890 in profits. I am holding long derivative positions in NUGT.
NUGT
(Click on image to enlarge)
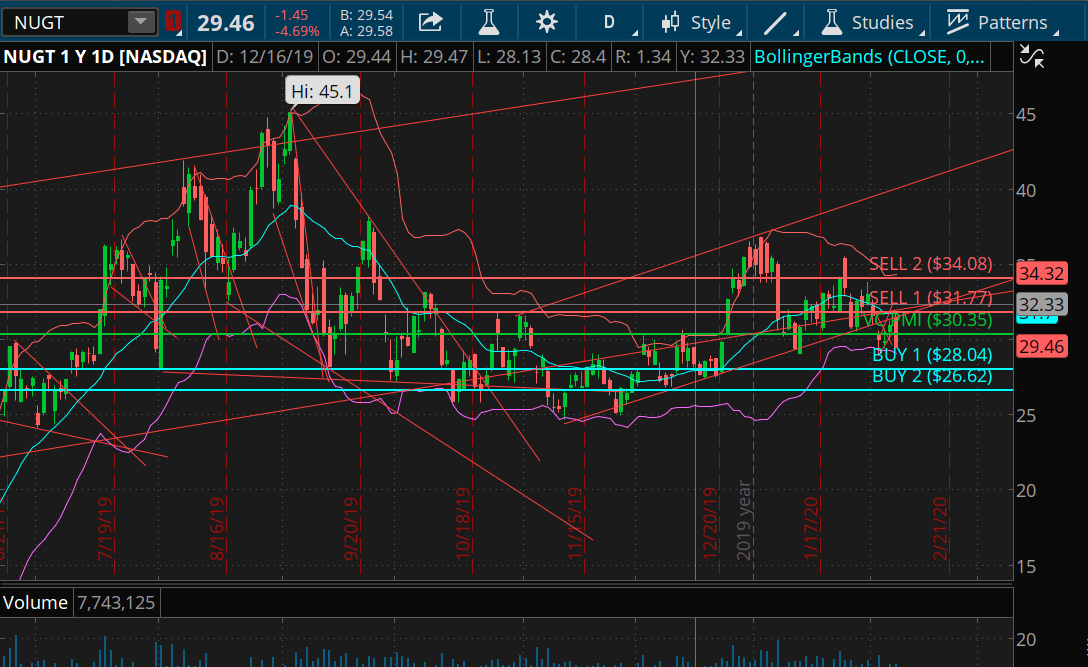
Courtesy: TDAmeritrade
One of the derivatives we follow is NUGT. We took profit yesterday on NUGT and are waiting to buy back in. We are trading NUGT on the long side to eliminate the margin risk of a futures contract, which most people cannot afford. NUGT allows you to hang onto the trend of the market until targets are met.
We've been trading back and forth between the daily mean of $1,566 and the Buy 1 level of $1,571 in gold. The market once again at about 5:30 am activated another buy signal after this big bar came down and tested $1,554.50 before it went right up again and activated a buy signal at $1,571. We recommend holding derivatives such as NUGT to the long side in order to manage margin risk.
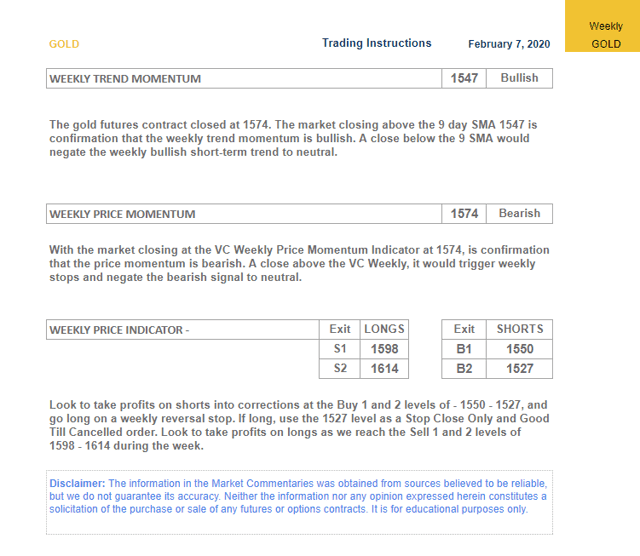
What To Expect Next Week?
The price momentum of $1,547 is bullish.
The weekly VC PMI of $1,574 is bearish.
A close above the $1,574 stop, negates this bullishness neutral. If short, cover your position at $1,550 - $1,527 and reverse to go long on a close above $1,550, if activated. If long activated, use $1,527 SCO.
(Click on image to enlarge)
Disclosure: I am/we are long NUGT. I wrote this article myself, and it expresses my own opinions. I have no business relationship with any company whose stock is mentioned in this ...
more

