
Corn And Wheat Weekly Forecasts For Nov. 23 - 27
Wheat: This/Next Week Forecast (November 23 - 27, 2020)
Uptrend scenario
An uptrend will start as soon, as the market rises above resistance level 611, which will be followed by moving up to resistance level 633.
Downtrend scenario
An downtrend will start as soon, as the market drops below support level 580, which will be followed by moving down to support level 543.

previous week wheat price forecast

Fundamental Analysis
Difference between supply and demand shows fair price between the levels 500 - 540.

Wheat - Monthly Forecast
Uptrend scenario
The uptrend may be expected to continue in case the market rises above resistance level 633, which will be followed by reaching resistance level 705.
Downtrend scenario
An downtrend will start as soon, as the market drops below support level 591, which will be followed by moving down to support level 573 and 543.

Corn: This/Next Week Forecast (November 23 - 27)
Uptrend scenario
The uptrend may be expected to continue in case the market rises above resistance level 437, which will be followed by reaching resistance level 460.
Downtrend scenario
An downtrend will start as soon, as the market drops below support level 423, which will be followed by moving down to support level 413 and if it keeps on moving down below that level, we may expect the market to reach support level 390.

previous week forecast
Fundamental Analysis
Difference between supply and demand shows fair price on the level 390.

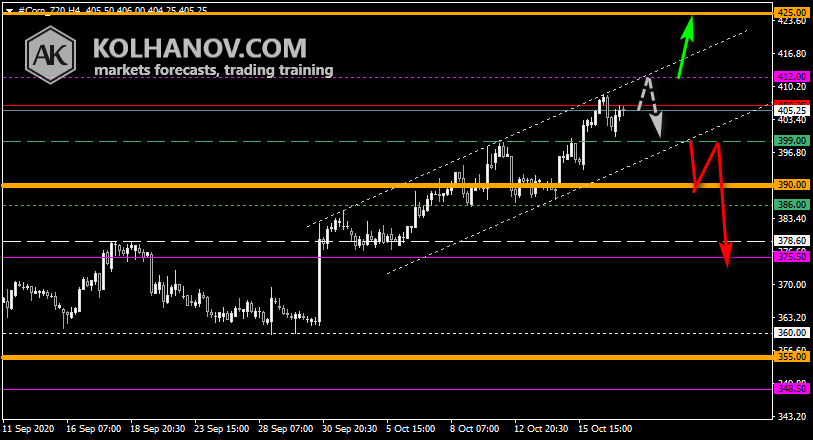
Corn - Monthly Forecast
Uptrend scenario
The uptrend may be expected to continue in case the market rises above resistance level 425, which will be followed by reaching resistance level 460.
Downtrend scenario
An downtrend will start as soon, as the market drops below support level 390, which will be followed by moving down to support level 355.

Disclaimer: All information provided by Anton Kolhanov is for informational purposes only. Information provided is not meant as investment advice nor is it a recommendation to Buy or Sell ...
more

