
Copper/Gold Ratio Trend Reflects Strengthening Economy & Higher Stock Market
The copper:gold ratio is one of the untold wonders of market analysis. Why? Because, historically, it is a reliable barometer on the global economic outlook and future direction of the stock market – and here is what it is saying these days.
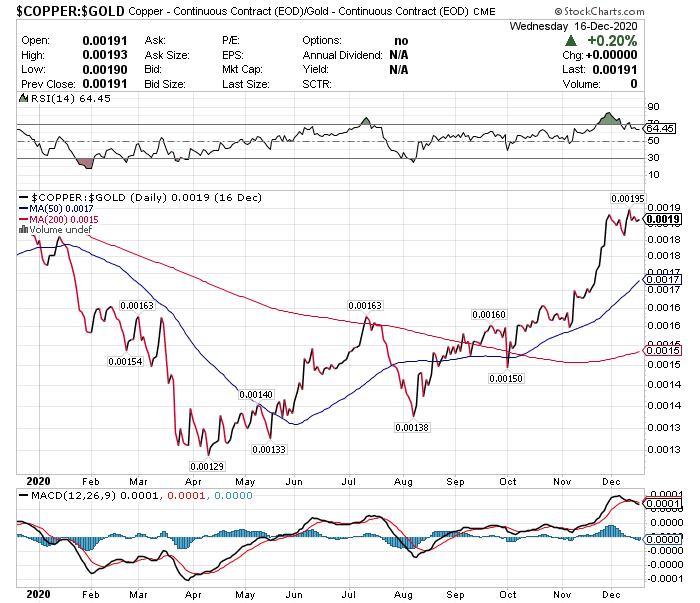
As can be seen in the chart below, the ratio broke above its 50-week moving average in mid-October.
(Click on image to enlarge)
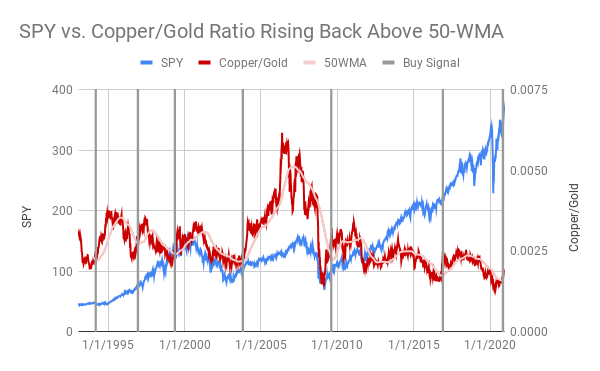
As can be seen in the chart below from WingCapital Investments, when the copper:gold ratio goes up the S&P 500 goes down and vice versa. Indeed, over the past 30 years, major reversals in the copper:gold ratio have preceded significant rallies in the S&P 500. How significant? Well, the S&P 500 has gained 8% and 12% in the ensuing 6 and 12 months, respectively, following the ratio's breakout above its 50WMA by at least 5 consecutive weeks.
(Click on image to enlarge)
The above correlation makes perfect sense given the fact that copper is an industrial metal and demand increases during periods when economic output is rising while investors buy gold as protection from either an economic crisis or inflation.
The above mentioned different uses of the metals enable the copper:gold ratio to act as an accurate barometer of global growth where:
- a declining copper:gold ratio shows a weakening economy
- a rising copper:gold ratio shows a strengthening economy
Copper's current sustained trend of outperformance vs. the safe haven gold suggests a global economic recovery is underway, suggesting a cyclical rally in the broader stock market will continue going forward.
Visit munKNEE.com and register to receive our free Market Intelligence Report newsletter (sample more


