
Copper Surges Into Overbought As Silver Erases Yearly Losses
A combination of US Dollar weakness and market optimism has seen Silver and Copper prices rally back to pre-crisis levels.
With the historic amount of fiscal and monetary stimulus unleashed in response to the COVID-19 pandemic, the dollar has sunk to 3-month lows and this run may continue as the Federal Reserve expands its Main Street Lending Program ahead of the June 11th interest rate decision and Chair Jerome Powell's press conference.
Continued support from the central bank and Chairman Jerome Powell’s commitment to do “everything we can as long as we can” combined with improving economic data, highlighted by the US economy adding 2.5 million jobs in May, could continue to fuel the rally in risk-sensitive commodity prices.
SILVER (XAG/USD) DAILY PRICE CHART
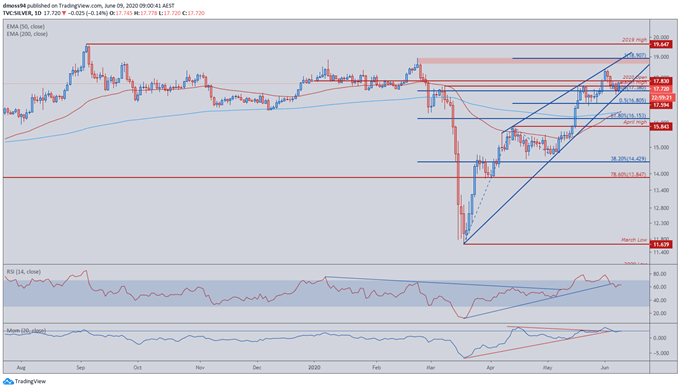
Source - Trading View
Silver has surged since the late-February sell-off catapulted prices to 11-year lows, with the white metal climbing just shy of 60% from the March low (11.64).
Although RSI sliding below 70 led to Silver dipping back under the yearly open (17.83), a bullish moving average cross-over could invigorate buyers to push prices back to the monthly high (18.38).
Furthermore, RSI strengthening into overbought territory once again could prove to be the trigger for prices to carve a path to the yearly high (18.94), with a daily close above the 19-handle bringing the 2019 high (19.65) within touching distance.
However, with price remaining contained in a bearish Rising Wedge pattern a break of trend support and close below the 78.6% Fibonacci (17.38) could see Silver fall back to the 200-day moving average (16.44), with the next key region of interest falling at the April high (15.84)
COPPER (XCU/USD) DAILY PRICE CHART
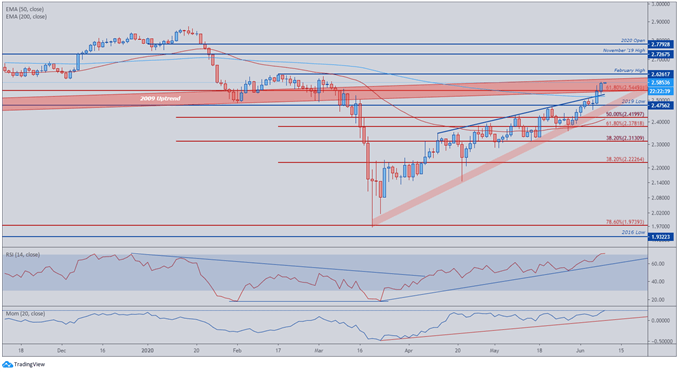
Source – Trading View
The global growth proxy has broken into an overbought territory for the first time since February 2018, as it carves a path back to the yearly open (2.779) climbing over 30% from the 4-year lows it set in early-March (1.967).
Doctor Copper looks to continue its run of fine form as it tests 2009 trend support-turned-resistance (2.55 – 2.60) after pushing through resistance at the 200-day moving average (2.517), invalidating the Rising Wedge bearish continuation pattern that confined price throughout April and May.
The February high (2.626) provides the next key area of interest and may cap upside potential, however, a daily close above this level could signal a push towards the psychologically imposing 2.70-handle.
However, as both RSI and momentum register their most extreme readings since February 2018 there is potential for copper prices to consolidate; replicating what occurred two and a half years ago.
Failure of price to close above the upper range of trend resistance (2.60) could initiate a period of consolidation, with the 61.8% Fibonacci (2.545) and the 200-MA (2.517) providing immediate support.


