
Copper Price Outlook: XCU/USD May Fall As RSI Diverges With Price
The price of copper has long been used as a gauge of world economic growth, with rising prices tending to suggest an increase in global manufacturing and construction.
However, glancing at the most recent manufacturing PMI numbers from the United States (49.8), the Euro-zone (47.4), the United Kingdom (50.1), Canada (47.8) and Australia (51.5) hardly reflects a robust recovery in global manufacturing activity.
Of course, the “forward-looking mechanism” of financial markets may be driving copper prices higher, as developed economies begin to loosen coronavirus-imposed restrictions and fundamental data points continue to trend in a positive direction.
That being said, supply-and-demand dynamics could also be responsible for copper’s 51% surge from the lows of March, as Chinese imports of the ductile metal exploded to record highs last month.
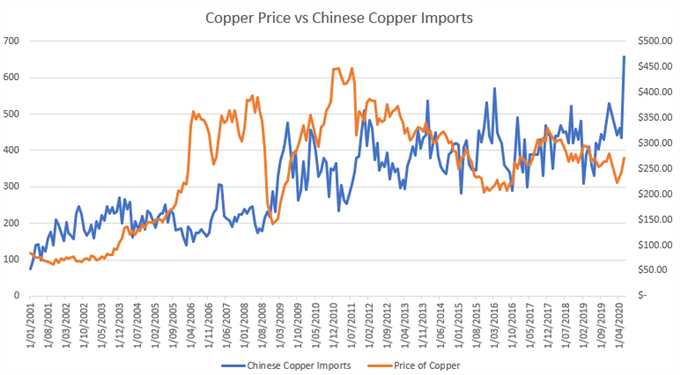
Data Source – Bloomberg
Looking at the chart above, it appears Chinese importers tend to maximize copper purchases when prices are relatively low, with a significant drop in demand seen when prices trek higher.
This inverse correlation should be noted by market participants as the recent appreciation may deter uptake, potentially suppressing demand from the world’s biggest buyer and capping the upside for the global-growth proxy.
China purchased $31.7B of copper ore in 2018; Japan came in second with a measly $9.19 billion.
Furthermore, a breakdown in the inverse relationship between supply and price may also concern copper bulls, as the two variables have notably moved in tandem for the last year.
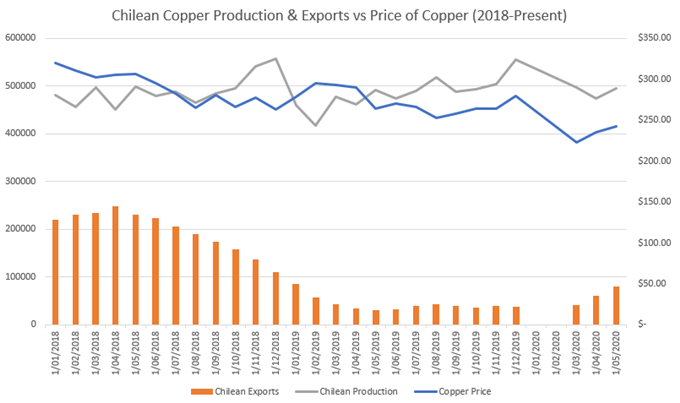
Data Source – Bloomberg
Despite Chilean production recovering in recent months price has continued to climb, suggesting that the substantial weakness seen in the US Dollar could be acting as the perfect tailwind for the orange-metal.
So, the haven currency’s fortunes – a function of broad-based market sentiment in recent months - are probably an important consideration along with Chinese demand in shaping copper’s performance.
A continuation of the current environment may propel price to fresh two-year highs.
Conversely, a period of risk aversion probably generates a swift pullback in prices with a significant fall in demand potentially exacerbating the decline.
COPPER DAILY CHART – OVERBOUGHT CONDITIONS DRIVING PRICES HIGHER
(Click on image to enlarge)
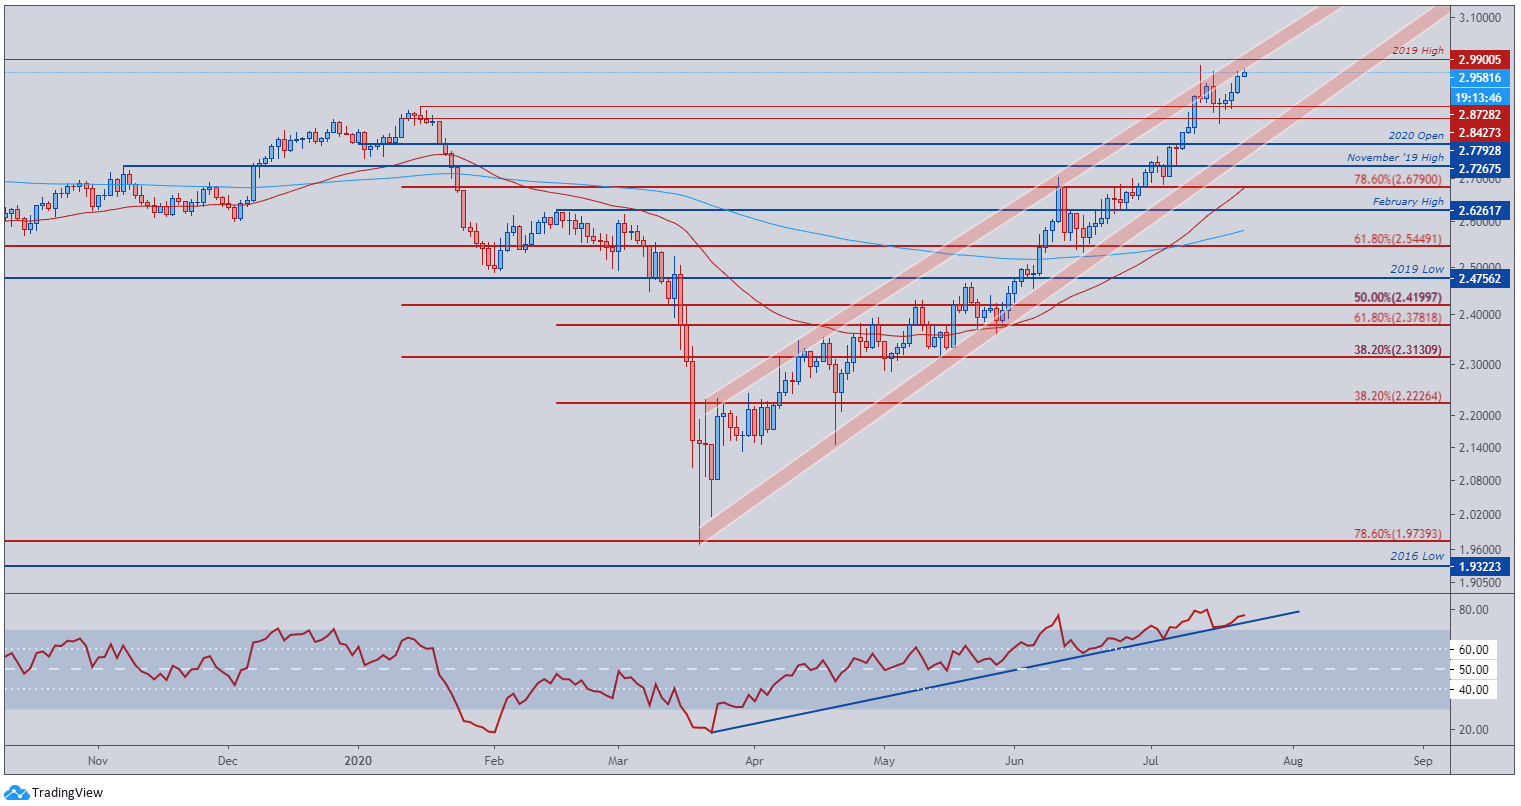
Copper daily chart created using TradingView
From a technical standpoint, the outlook for copper remains tilted to the upside as the price continues to track in a bullish Ascending Channel and the RSI surges back into overbought territory.
However, the oscillator looks to be diverging with price as it fails to climb to higher highs, suggesting the recent uptrend may be running out of steam.
Resistance at the 2019 high (2.99) may be a step too far for buyers, with a potential correction back to the January high (2.87) and channel support looking in the offing as price fails to break above the July high (2.97).


