
Copper Price Forecast: US Q3 GDP And Chinese PMI In Focus
Copper retraced a portion of its recent break higher over the previous two trading sessions. The COMEX futures price stands at $3.1405 (-0.41%) per pound as of Friday afternoon. Price action hit a 28-month high earlier this week following stronger than expected industrial production data out of China. Underlying market forces and Chinese economic strength amid the pandemic have bolstered the red metal’s gain to nearly 60% from the March lows.
COPPER FUTURES (DAILY PRICE CHART)
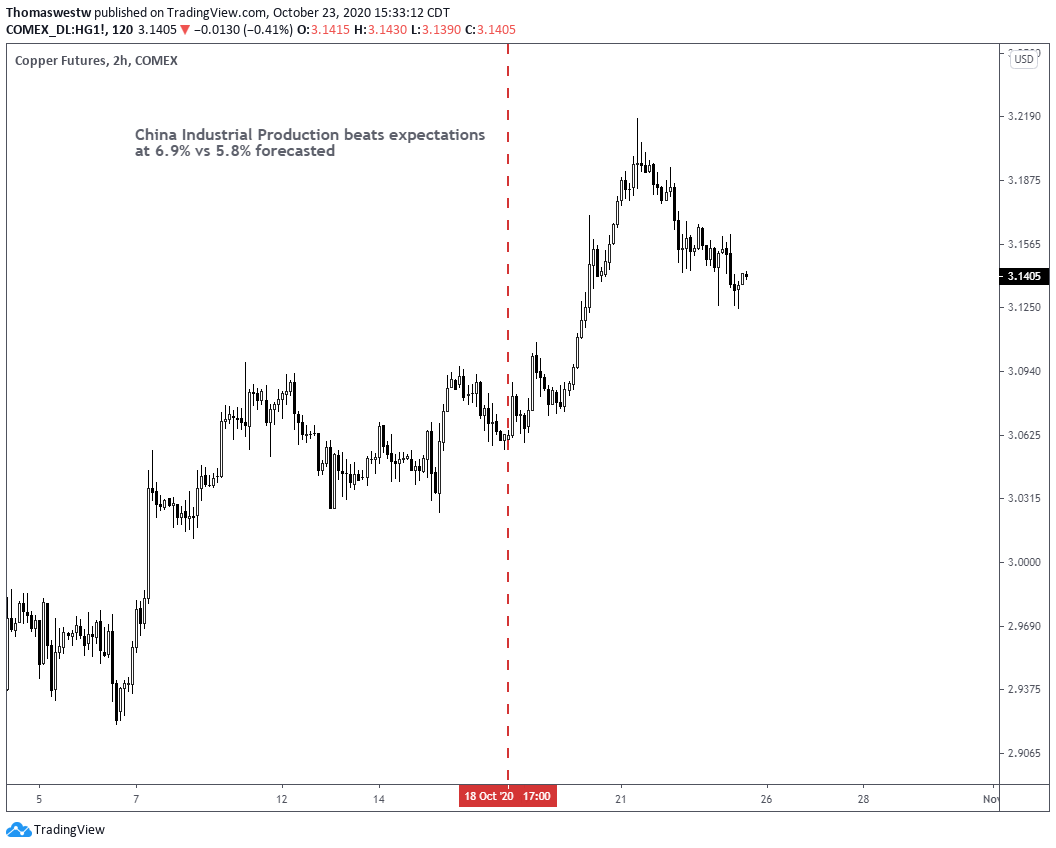
Chart created with TradingView
The recent pullback echoes across the broader group of metals with Gold and Silver both losing ground alongside copper in recent days. As the 2020 U.S. election nears – now only 11 days out – markets appear to be relatively calm. While Biden commands a lead in the polls, the outcome, along with election day aftermath remains uncertain. However, stimulus talks are one issue that could move the ball in the coming days, although hopes for a deal are quickly fading as the election quickly approaches.
That said, several high-impact economic events are slated for release next week, with the prime drivers likely being advance Q3 U.S. GDP and Chinese Manufacturing PMI. Economic growth in the United States is expected to cross the wires at 31.9% on a quarterly basis – a modern record. China’s economy, the world’s largest copper consumer, will look to record an eighth consecutive month of manufacturing growth. Positive data on either release may likely give a boost to the red metal.
DAILYFX ECONOMIC CALENDAR
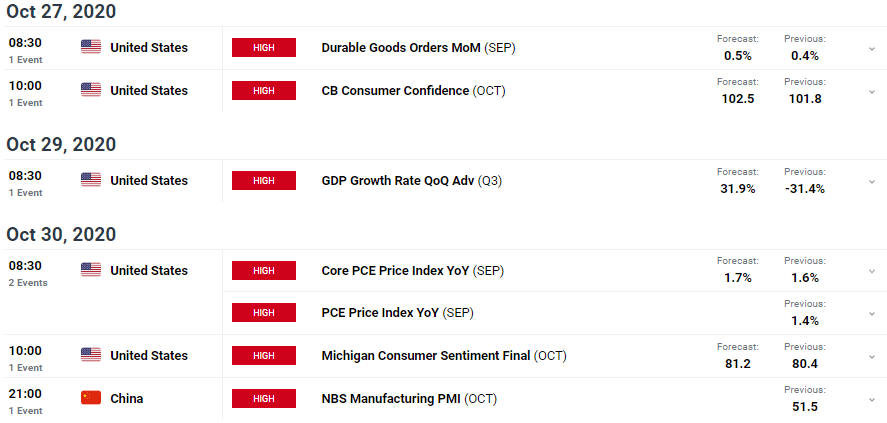
Source: DailyFX Economic Calendar
Furthermore, a recent rally in the Chinese Yuan against the US Dollar may be supporting copper prices through a speculative function in markets. A weak USD is bullish for commodities in general; however, with China being the largest consumer of copper, a strong Yuan may serve as a particularly bullish backstop. Currently, USD/CNH is trading at 6.6676 – the weakest since July 2018.
COPPER VS USD/CNH (INVERTED) DAILY PRICE CHART
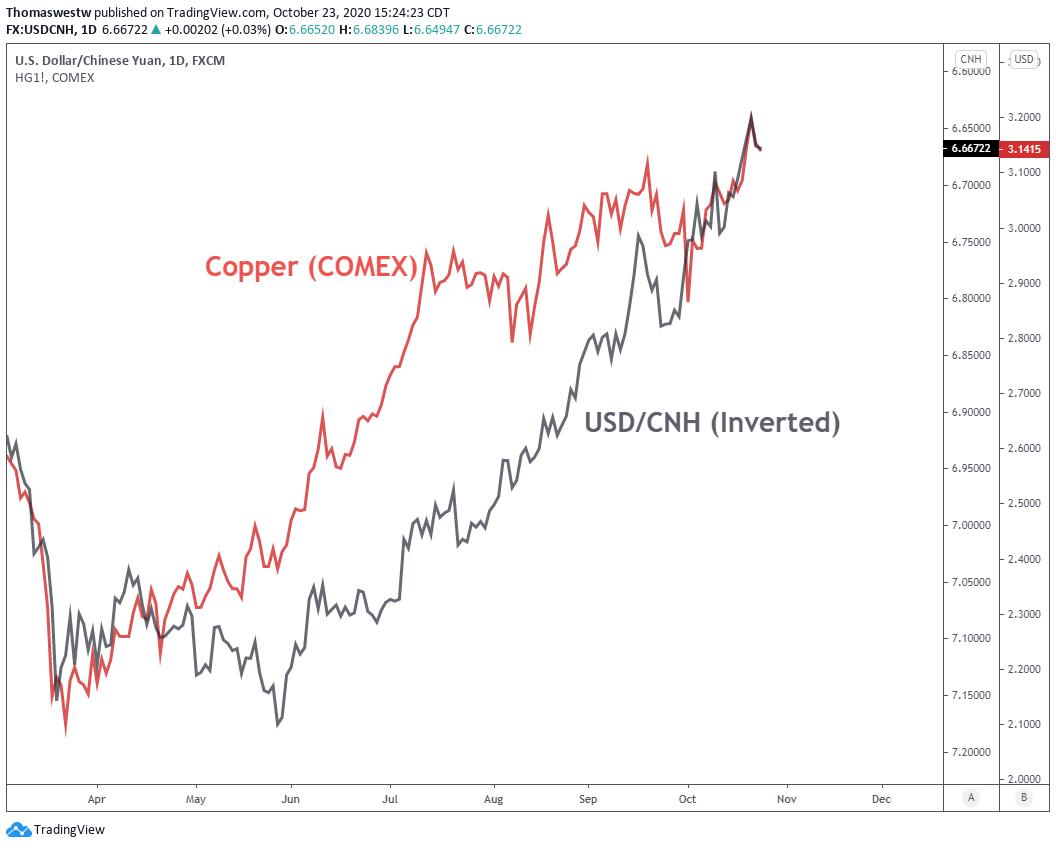
Chart created with TradingView
Disclosure: See the full disclosure for DailyFX here.


