
Copper Price Forecast: Bull Case To Prevail On Robust Supply And Demand Drivers
Copper prices continue to soar as the global economic recovery strengthens amid a backdrop of loose monetary and financial conditions, slowing Covid-19 infection rates, and shifting energy policies. The red metal will record its sixth consecutive monthly increase if the current trend holds, with all-time highs in view.
The industrial metal is trading at its highest level since mid-2011 when prices were coming off a record peak following a commodity supercycle that pushed copper and other metals into the stratosphere. The current rally suggests we are now in another one. That hypothesis may be confirmed soon if prices break the approaching all-time high of $4.649.
A new all-time high would certainly solidify the bull case for copper and potentially beget even higher highs. Current supply and demand conditions are favoring commodity prices. While there are many gradations under close examination, the bullish narrative for copper can be broken down into simpler terms. Supply will likely remain under pressure as stimulus-driven demand bolsters prices.
One reason supply will likely remain under pressure is the amount of time it takes – which is estimated at around 8-10 years per industry experts – to get a copper mine up and running. That said, major physical inventory levels are nearing record lows, with the London Metals Exchange’s current copper inventory level near 15-year lows (see chart below).
The demand side is equally bullish, driven by government stimulus spending centered around infrastructure, particularly China which is the world’s largest copper importer. Moreover, the world is shifting towards clean energy solutions to add and replace energy consumption. The green energy push is heavily reliant on metals like copper. In addition, as global economic activity continues to expand coming out of the pandemic, it will likely drag the red metal along for the ride.

Copper Technical Forecast
Copper found support near its 12-day Exponential Moving Average (EMA) after dropping from a multi-year high in late February. The subsequent move saw prices rally before stopping short of the 61.8% Fibonacci retracement level. Despite the recent move lower, March’s monthly gain remains intact at a little north of 2%
A move lower would likely see the 12-day EMA step in to underpin price action again. A break below that would start eating further into February’s price action. To the upside, bulls have the multi-year high of 4.363 in focus and breaking above that level would bring the all-time high into scope for a potential extension beyond.
Copper Daily Chart
(Click on image to enlarge)
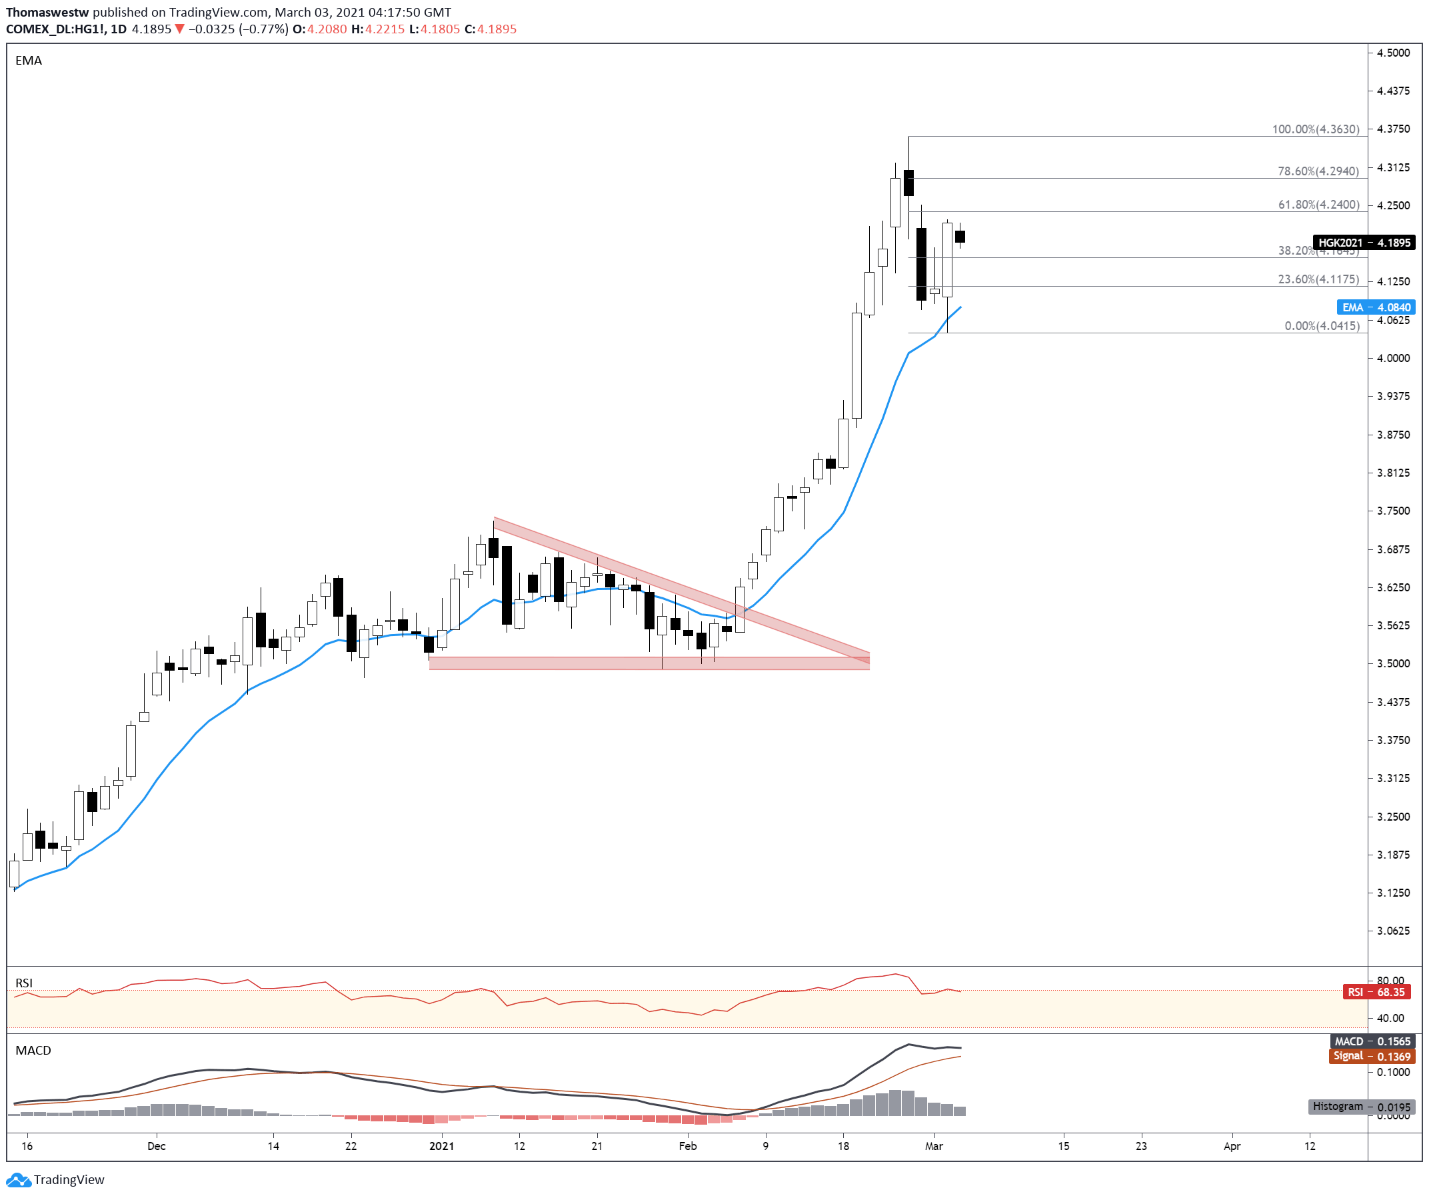
Chart Created with TradingView
Disclosure: See the full disclosure for DailyFX here.


