
Commitment Of Traders - Futures In The Near Future; Hedge Fund Positions
Following futures positions of non-commercials are as of December 11, 2018.
10-year note: Currently net short 393.8k, up 100.6k.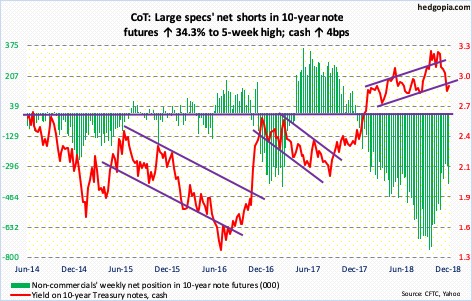
Next week – on Dec. 18-19 – the FOMC meets. This is the last meeting this year. A 25-basis-point raise is expected, with the futures market assigning 77-percent odds. If the Fed holds up on a hike, equity markets in particular will be pleasantly surprised. At the same time, they will be immensely disappointed if there is no dovish shift in the Fed’s language. Until the last meeting, the dot plot expected three hikes next year. Markets expected just one and would like FOMC members to shift downward. As things stand, this looks like the path of least resistance.
On November 28, Jerome Powell, Fed chair, in a speech said interest rates were “just below” neutral. Stocks rallied. This was a U-turn for him. On October 3, the same day the S&P 500 large cap index began its waterfall dive, he had said rates were still “a long way” from neutral, suggesting continued tightening in the weeks/months ahead. If he misspoke two weeks ago, he would have the opportunity to make a correction next week.
Except for stocks in the midst of a selloff and a flatter yield curve, there has not been much change in macro variables since the aforementioned speech early October. Most data had been in deceleration even before that. And stocks were doing fine. But from the intraday high early October to this Monday’s low, the S&P 500 gave back 12.1 percent. In the meantime, the spread between 10- and two-year Treasury yields narrowed to 11 basis points twice this month.
The long end of the curve continues to warn the Fed not to get too tight. Now, equities have joined credit. Odds favor softening in the Fed’s tone/language.
30-year bond: Currently net short 62.2k, down 10.4k.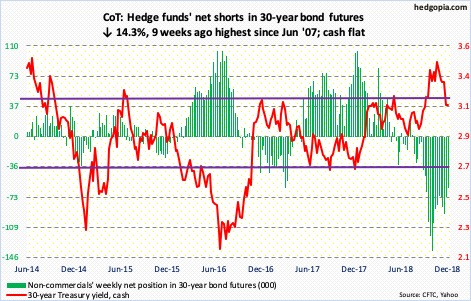
Major economic releases next week are as follows.
December’s NAHB housing market index and Treasury International Capital System data for October are due out Monday.
Builder sentiment collapsed eight points month-over-month in November to 60. Last December’s 74 was the highest since July 1999.
Foreigners continue to reduce exposure to US stocks. In the 12 months to September, they sold $26.8 billion worth. As recently as January, they were buying $135.7 billion worth.
Housing starts for November come out Tuesday. Starts increased 1.5 percent m/m in October to a seasonally adjusted annual rate of 1.23 million units. January’s cycle high 1.33 million units was the highest since July 2007.
November’s existing home sales are on tap Wednesday. Sales rose 1.4 percent m/m in October to 5.22 million units. The cycle high 5.72 million units in November last year was the strongest since February 2007.
Friday brings durable goods (November), GDP (3Q18, third estimate), corporate profits (3Q18, revised), personal income (November) and University of Michigan’s consumer sentiment index (December, final).
Orders for non-defense capital goods ex-aircraft – proxy for business capex plans – rose 3.4 percent year-over-year in October to $69.3 billion (SAAR).
The second estimate showed real GDP expanded 3.5 percent in 3Q18. This comes on the heels of 4.2-percent growth in 2Q.
Preliminarily, corporate profits with inventory valuation and capital consumption adjustments jumped 10.3 percent y/y to $2.32 trillion (SAAR). This was the strongest growth rate in six years.
In the 12 months through October, core PCE – the Fed’s favorite measure of consumer inflation – rose 1.78 percent. July’s 2.02-percent rise was the first two-plus reading since April 2012.
The preliminary estimate showed consumer sentiment remained unchanged m/m in December at 97.5. March’s 101.4 was the strongest showing since January 2004.
Crude oil: Currently net long 369.3k, down 22.7k.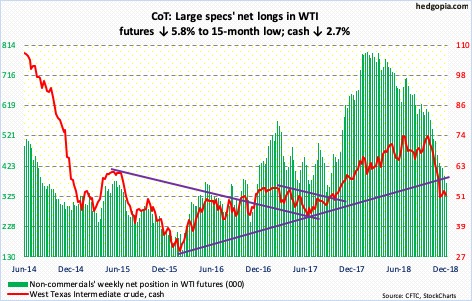
Spot West Texas Intermediate crude ($51.20/barrel) is trying to stabilize, with essentially sideways action the past three weeks. It dropped from $76.90 on October 3 to $49.41 on November 29. The weekly chart in particular is deeply oversold.
This week, the crude lost 2.7 percent. This was preceded by a weekly long-legged doji last week and a spinning top before that. Immediately ahead, resistance lies at $54.50-$55.
For the week ended November 30, US crude production dropped 100,000 barrels per day to 11.6 million bpd. Crude stocks fell 1.2 million barrels to 442 million barrels. Distillate inventory declined 1.5 million barrels to 124.1 million barrels. Gasoline stocks, however, rose 2.1 million barrels to 228.3 million barrels. As did crude imports, which increased 174,000 bpd to 7.4 mbpd. Refinery utilization inched down four-tenths of a percentage point to 95.1 percent.
E-mini S&P 500: Currently net long 174.2k, up 70.1k.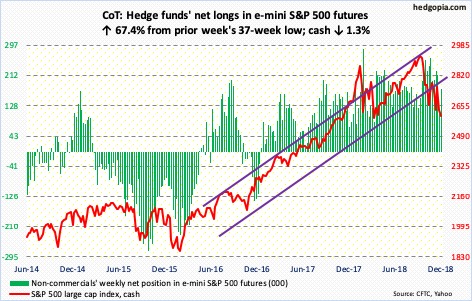
Bulls and bears are feverishly trying to defend their turf, with the former fighting for support and the latter attacking resistance. Since the cash (2599.95) began selling off on October 3, bears repeatedly showed up at 2800, which since February this year has proven to be an important level. Bulls, on the other hand, have put their foot down near 2600, which goes back to February this year. Risk of a breach is rising. In the sessions ahead, 2630s is worth watching; shorts may show up there.
The S&P 500 lost 1.3 percent this week. In the week ended Wednesday, US-based funds lost record $46.2 billion (courtesy of Lipper). In the same week, $4.3 billion came out of SPY (SPDR S&P 500 ETF) and $1.6 billion out of IVV (iShares core S&P 500 ETF), even as VOO (Vanguard S&P 500 ETF) gained $290 million (courtesy of ETF.com).
Also worth noting is the amount of potential dry powder that is accumulating. As of Wednesday, US money-market-fund assets held $3 trillion, which is the highest since March 2010.
Euro: Currently net short 56.3k, down 4.5k.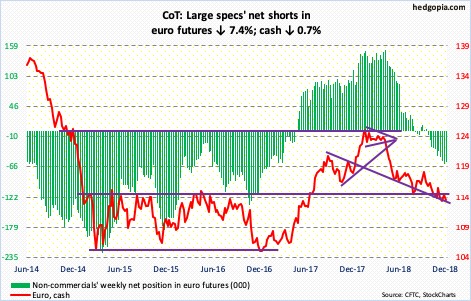
As expected, the ECB left interest rates unchanged this week. Eurozone QE is set to end at the end of the month, although the bank will continue to reinvest cash from maturing bonds. It has already said it would not raise interest rates until next summer at the earliest. If anything, the risk is to the downside in this outlook. The economy is decelerating. Thursday, Mario Draghi, ECB president, said risks were shifting to the downside.
Ahead of this, the cash ($113.07) tried to rally but was resisted at the 50-day moving average as it rose to $114.29 Monday. Bulls thus far have managed to defend $113, but rallying off of this support has proven difficult.
Gold: Currently net long 60.5k, up 11.5k.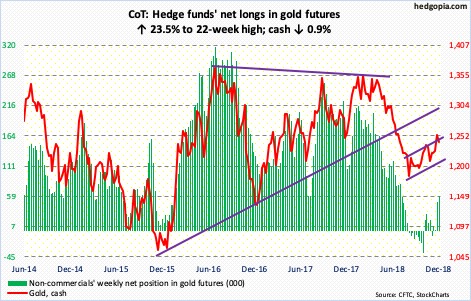
In the week to Wednesday, GLD (SPDR gold ETF) took in $224 million and IAU (iShares gold trust ETF) $100 million (courtesy of ETF.com).
The cash ($1,241.40/ounce) last Tuesday broke out of resistance at $1,240. Near term, here is the thing, though. Gold dropped from $1,369.40 in April to $1,167.10 mid-August. The upper end of a rising channel drawn from that low lies around $1,255. The metal rose to $1,256.60 intraday Monday, just under the 200-day and just outside the daily upper Bollinger band.
The daily is itching to go lower. The 50-day lies at $1,225.67. After that, there is support at $1,213, which for nearly five months now has seen a decent tug of war between bulls and bears.
Nasdaq 100 index (mini): Currently net short 3k, down 7.3k.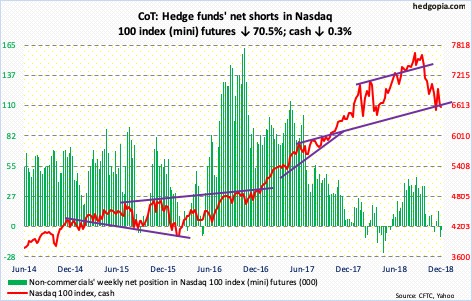
Looking at the monthly chart, it feels like the cash (6594.96) wants to go lower still. The weekly can rally. Thus far, bulls have done a decent job of defending 6600, although the risk of a breach is rising on the daily. As long as this support holds, the path of least resistance is up. Nearest resistance lies at 6850, and 7100 after that. The latter approximates the 200-day (7073.83).
Flows were in cooperation in the week to Wednesday as $384 million moved into QQQ (Invesco QQQ Trust). In the prior week, it gained $1.2 billion (courtesy of ETF.com).
Russell 2000 mini-index: Currently net short 21.9k, down 13.4k.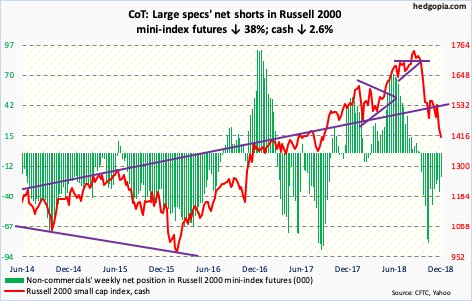
Of the major US equity indices, the cash (1410.81) acts the weakest. Support at 1450-ish goes back 17 months. This was undercut later last week. Several times this week, sellers showed up at that broken support. This is the line in the sand for now. From small-cap bulls’ perspective, the sooner it is recaptured, the better.
In the week to Wednesday, IWM (iShares Russell 2000 ETF) lost $185 million, while IJR (iShares core S&P small-cap ETF) gained $59 million (courtesy of ETF.com).
US Dollar Index: Currently net long 38.1k, down 327.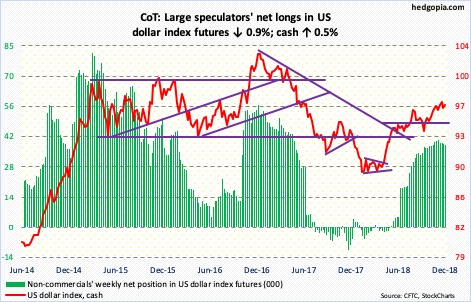
The cash (96.91) continues to remain above short-term support at 96.50-ish. At the same time, it has been unable to take out 97.50-ish even after several attempts. Tuesday’s intraday high of 97.52 kissed the daily upper Bollinger band as well as the upper bound of a seven-month ascending channel. The lower bound lies around 95.25. Right around there lies crucial horizontal support just north of 95.
VIX: Currently net long 40.1k, up 29.1k.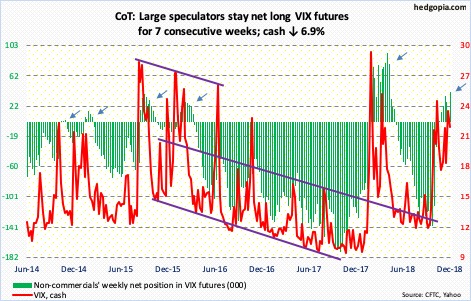
Since it spiked on October 11 to an intraday high of 28.84, the cash (21.63) has successfully tested the 200-day twice, one of which was last week. The rally since once again fell well short of that October high – retreated from 25.94 this time. A pattern of lower highs is intact. A retest of that average takes place at 16.05. The weekly chart has room to go lower.
Non-commercials have remained net long for seven weeks now.
In the meantime, the 21-day moving average of the CBOE equity-only put-to-call ratio ended the week at 0.707. It rose to 0.710 Tuesday. If the S&P 500 genuinely breaches 2600, the ratio could very well head toward the mid-0.70s, which is where it peaked in February 2016, when stocks reached a major bottom. Barring that, it is elevated enough for decent unwinding to unfold.
Disclaimer: This article is not intended to be, nor shall it be construed as, investment advice. Neither the information nor any opinion expressed here constitutes an offer to buy or sell any ...
more

