
Comex: Total Inventory Grows But Supply To Meet Delivery Shrinks

This analysis focuses on gold and silver within the Comex/CME futures exchange. See the article What is the Comex? for more detail. The charts and tables below specifically analyze the physical stock/inventory data at the Comex to show the physical movement of metal into and out of Comex vaults.
Registered = Warrant assigned and can be used for Comex delivery, Eligible = No warrant attached – owner has not made it available for delivery.
Current Trends
Gold
Banks restocked gold again for the third month in a row, but the makeup was a bit different. Rather than increasing in both Eligible and Registered, this month saw a drop in Registered and an increase in Eligible. The fall in Registered indicates that holders are removing their metal from the available supply for delivery. This month saw the largest reduction in Registered since October 2021.
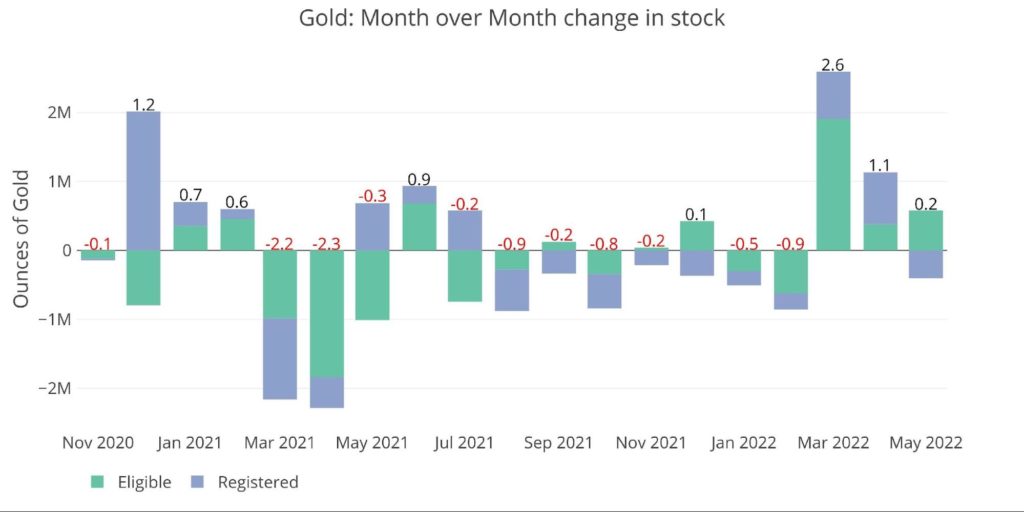
Figure: 1 Recent Monthly Stock Change
As can be seen below, the majority of the move happened in the last two days as the June contract nears delivery. The two moves happening in tandem show that this was holders moving from Registered to Eligible rather than metal flowing in and out.
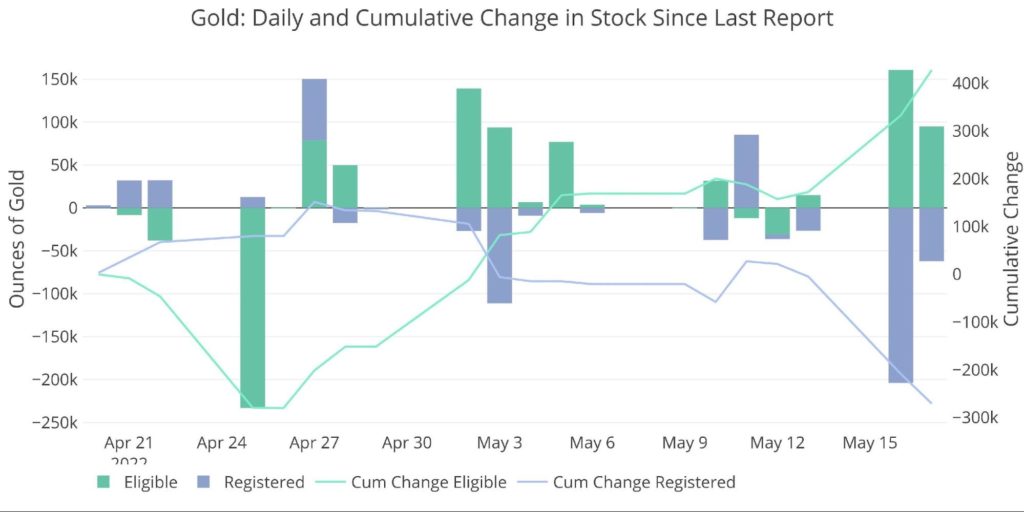
Figure: 2 Recent Monthly Stock Change
Silver
Silver has seen its first net inflow since December with 4.8M ounces flowing into Eligible so far. Unlike gold, this supply did not come from Registered but was new metal entering the vault.
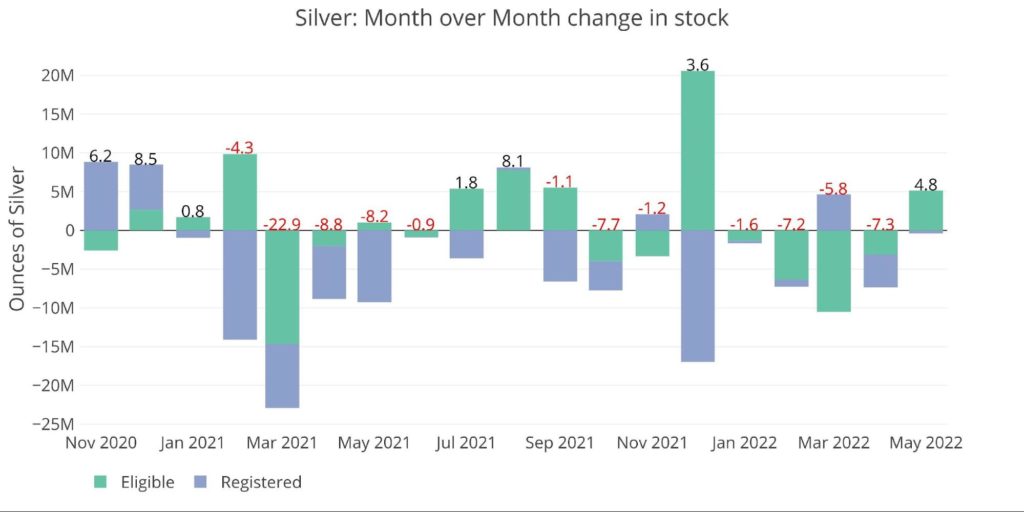
Figure: 3 Recent Monthly Stock Change
The chart below shows that this has been a steady accumulation over the last 30 days.
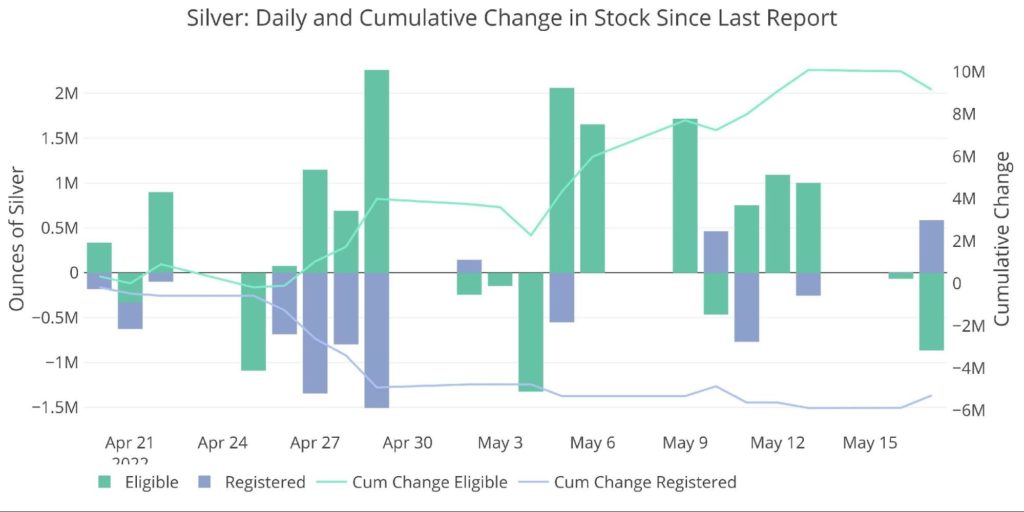
Figure: 4 Recent Monthly Stock Change
The table below summarizes the movement activity over several time periods.
Gold
- Over the last month, gold supply has only increased by a modest 0.4%
-
- Change in Registered is nearing zero over the last year
- Eligible has seen the majority of the stock increase over the last year
-
- Registered fell by over 1% in the last week alone
-
- Eligible was on the other side, increasing 1.3%
-
Silver
- Silver registered is down almost 30% over the last year or 35M ounces
-
- This is metal that was available for delivery
- Silver Registered is down another 6% over the last month (5.3M ounces)
-
- The 9M ounce increase in Eligible could be moved to Registered at a later date, but not necessarily
(Click on image to enlarge)
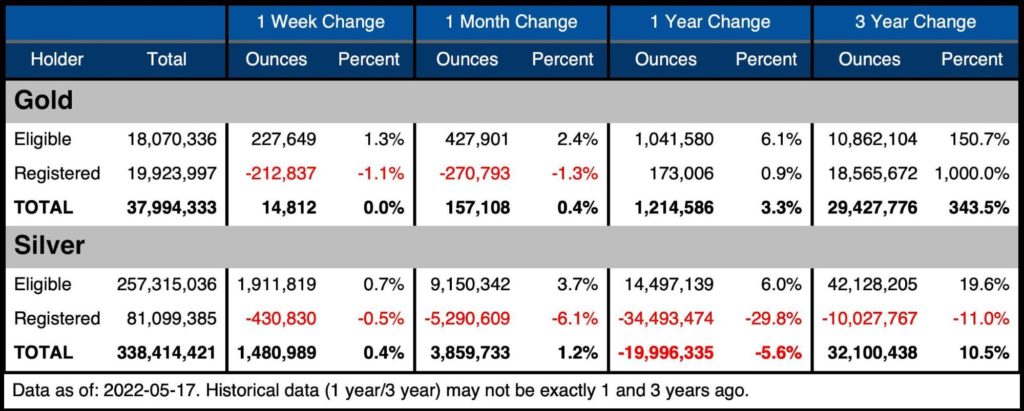
Figure: 5 Stock Change Summary
Pledged gold (a subset of Registered), continues to increase after the big jump on April 8th. Although Pledged is considered a subset of Registered, it cannot be made available for delivery without the Pledge being removed. Pledged represents gold that has been pledged as collateral. Removing Pledged from Registered in the table above would shrink the total Registered by over 10%.
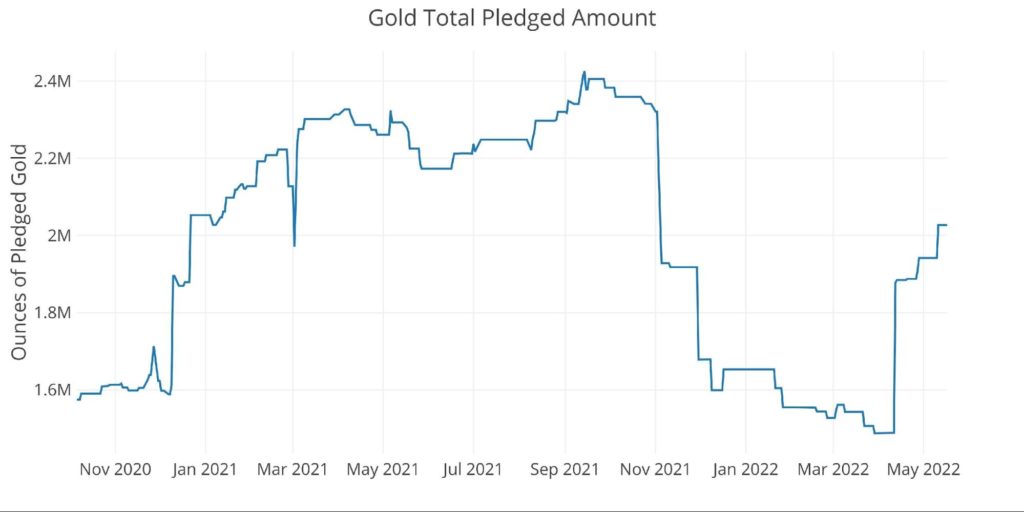
Figure: 6 Gold Pledged Holdings
The next table shows the activity by bank/Holder. It details the numbers above to see the movement specific to vaults.
Gold
- Fairly quiet this month with a mix of vaults adding and losing metal
- On a monthly basis, HSBC increased holding by 3.2% and Loomis saw a 21.4% total inventory increase
- In terms of outflows, Int Delaware and Manfra lost 10% and 4.4% respectively
Silver
- Four vaults increased their total inventory by almost 10%
-
- CNT, Delaware, HSBC, and INT all grew net inventories by 8.5% or more
-
- Similar to gold, outflows occurred at Loomis (-3.1%) and Manfra (-5.8%)
(Click on image to enlarge)
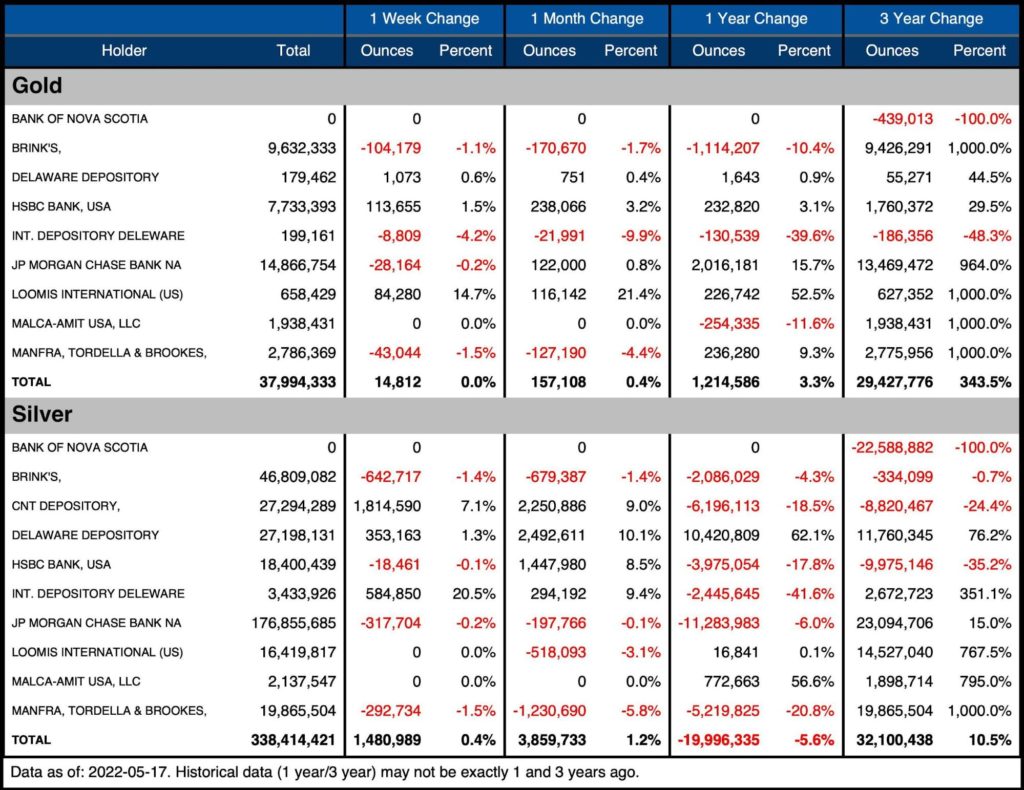
Figure: 7 Stock Change Detail
Unlike last month when gold and silver were moving in opposite directions, the two metals are moving in a similar fashion in the latest month.
Historical Perspective
Zooming out and looking at the inventory for gold and silver since 2016 shows the impact that Covid had on the Comex vaults. Gold had almost nothing in the Registered category before JP Morgan and Brinks added their London inventory with nearly 20M ounces.
The recent effort to restock is shown on the far right. From this perspective, the increase in inventory appears relatively small. With such a deep inventory, it seems strange for the banks to all be restocking right now. It’s possible that true inventory is much smaller than what appears.
(Click on image to enlarge)
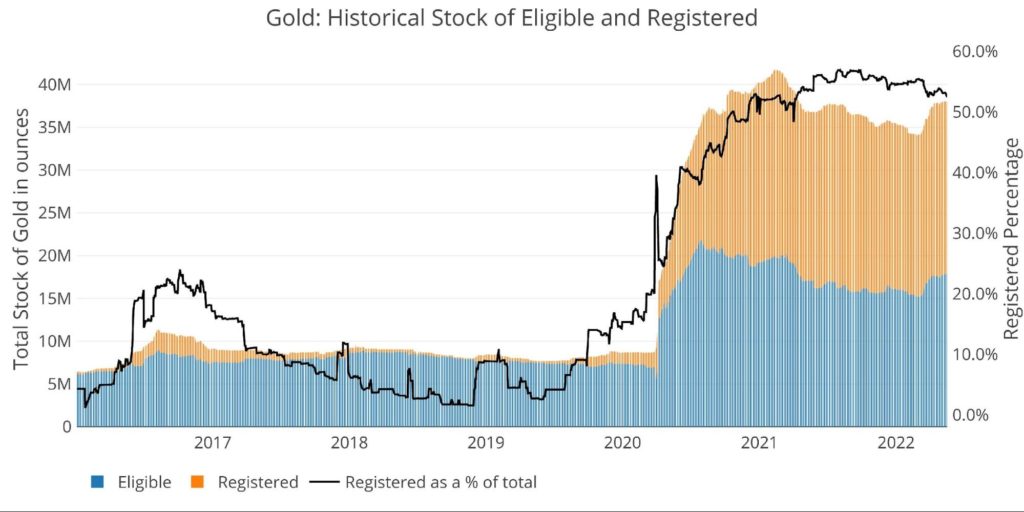
Figure: 8 Historical Eligible and Registered
Silver has seen a big move down in Registered as a % of the total. After a recent spike in March up to 27.1%, it has since fallen back to 23.8%. If Registered outflows continued, the ratio could hit the lowest level since April 2018.
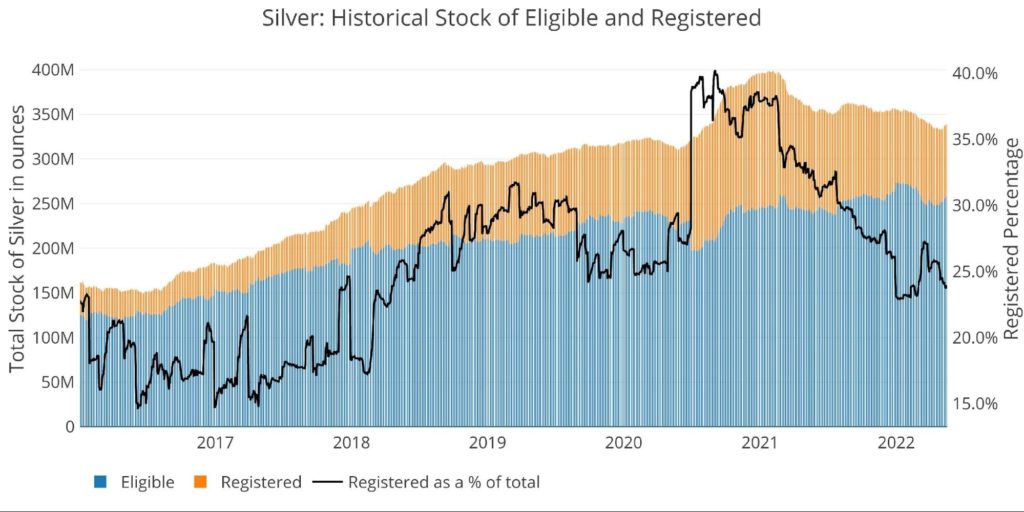
Figure: 9 Historical Eligible and Registered
Available supply for potential demand
As can be seen in the chart below, the ratio of open interest to total stock has fallen from over 8 to 1.46. In terms of Registered (available for delivery against open interest), the ratio collapsed from nose bleed levels (think Nov 2019 where 100% stood for delivery) down to 2.78 in the latest month. This is down from 3.41 in early March and 2.87 last month.
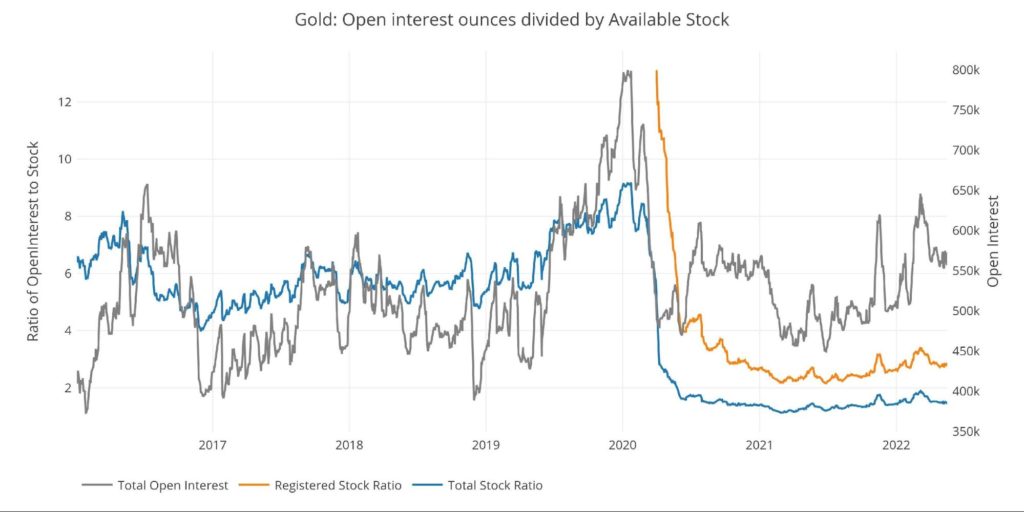
Figure: 10 Open Interest/Stock Ratio
Coverage in silver is weaker than in gold with 8.9 open interest contracts to each available physical supply of Registered (down from 9.87 in mid-April). The ratio collapsed mainly due to a dramatic fall in open interest from 170k to 142k.
The ratio was on the cusp of breaking into the 10 handle before the fall in open interest brought the ratio back down.
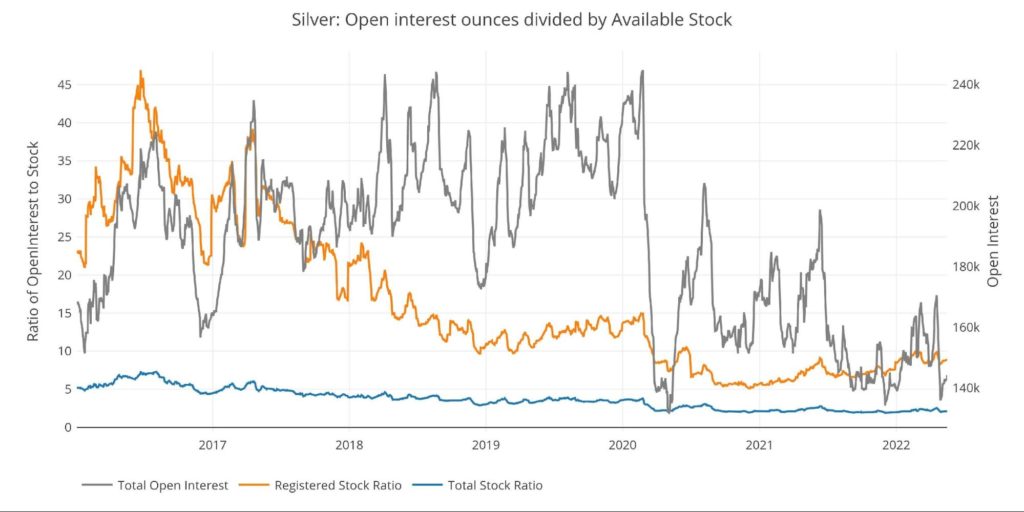
Figure: 11 Open Interest/Stock Ratio
Wrapping Up
After seeing significant activity over the last 18 months, the vaults were a bit quieter this month. Perhaps this is due to both gold and silver seeing hard pullbacks. Regardless, on the surface, the vaults look well-stocked to meet any demand coming. That being said, the movement within the vaults does lead to speculation as to how deep inventories really are if they were to be tested.
With inflation showing no signs of abating, and the Fed talking tough but doing nothing, it’s only a matter of time before precious metals get back on people’s radar. It’s likely the stocks at the Comex will be tested.
Data Source: https://www.cmegroup.com/
Data Updated: Daily around 3 PM Eastern
Last Updated: May 17, 2022
Gold and Silver interactive charts and graphs can always be found on the Exploring Finance dashboard: https://exploringfinance.shinyapps.io/goldsilver/


